
 Atatus
AI-Powered Observability Platform
Atatus gives engineering teams unified visibility across APM, logs, infrastructure, real user monitoring, distributed tracing, and error tracking to resolve production issues faster, before users notice.
The Features Behind Every Stable and Fast Application

Transaction-Level Visibility
Trace every request from entry to exit. Know exactly where time is lost across queries, external calls, and application layers.
Error Detection That Doesn't Miss
Catch exceptions, crashes, and silent failures the moment they occur with full stack traces and the context your team needs to fix them fast.

Metrics That Actually Mean Something
Response time, throughput, Apdex, failure rate tracked continuously, not sampled. See what's normal and get alerted the moment it isn't.

Dashboards Built for Engineering Teams
Every critical signal in one place. Customize views by service, host, or transaction so your team always knows where to look first.

Alerts Before Your Users Notice
Set thresholds on the metrics that matter. Get notified via Slack, PagerDuty, Email, or Teams, the moment something crosses the line.

Pricing That Scales With You
No seat-based traps or hidden overage fees. Pay for what you monitor, not what you might need. Transparent from day one.
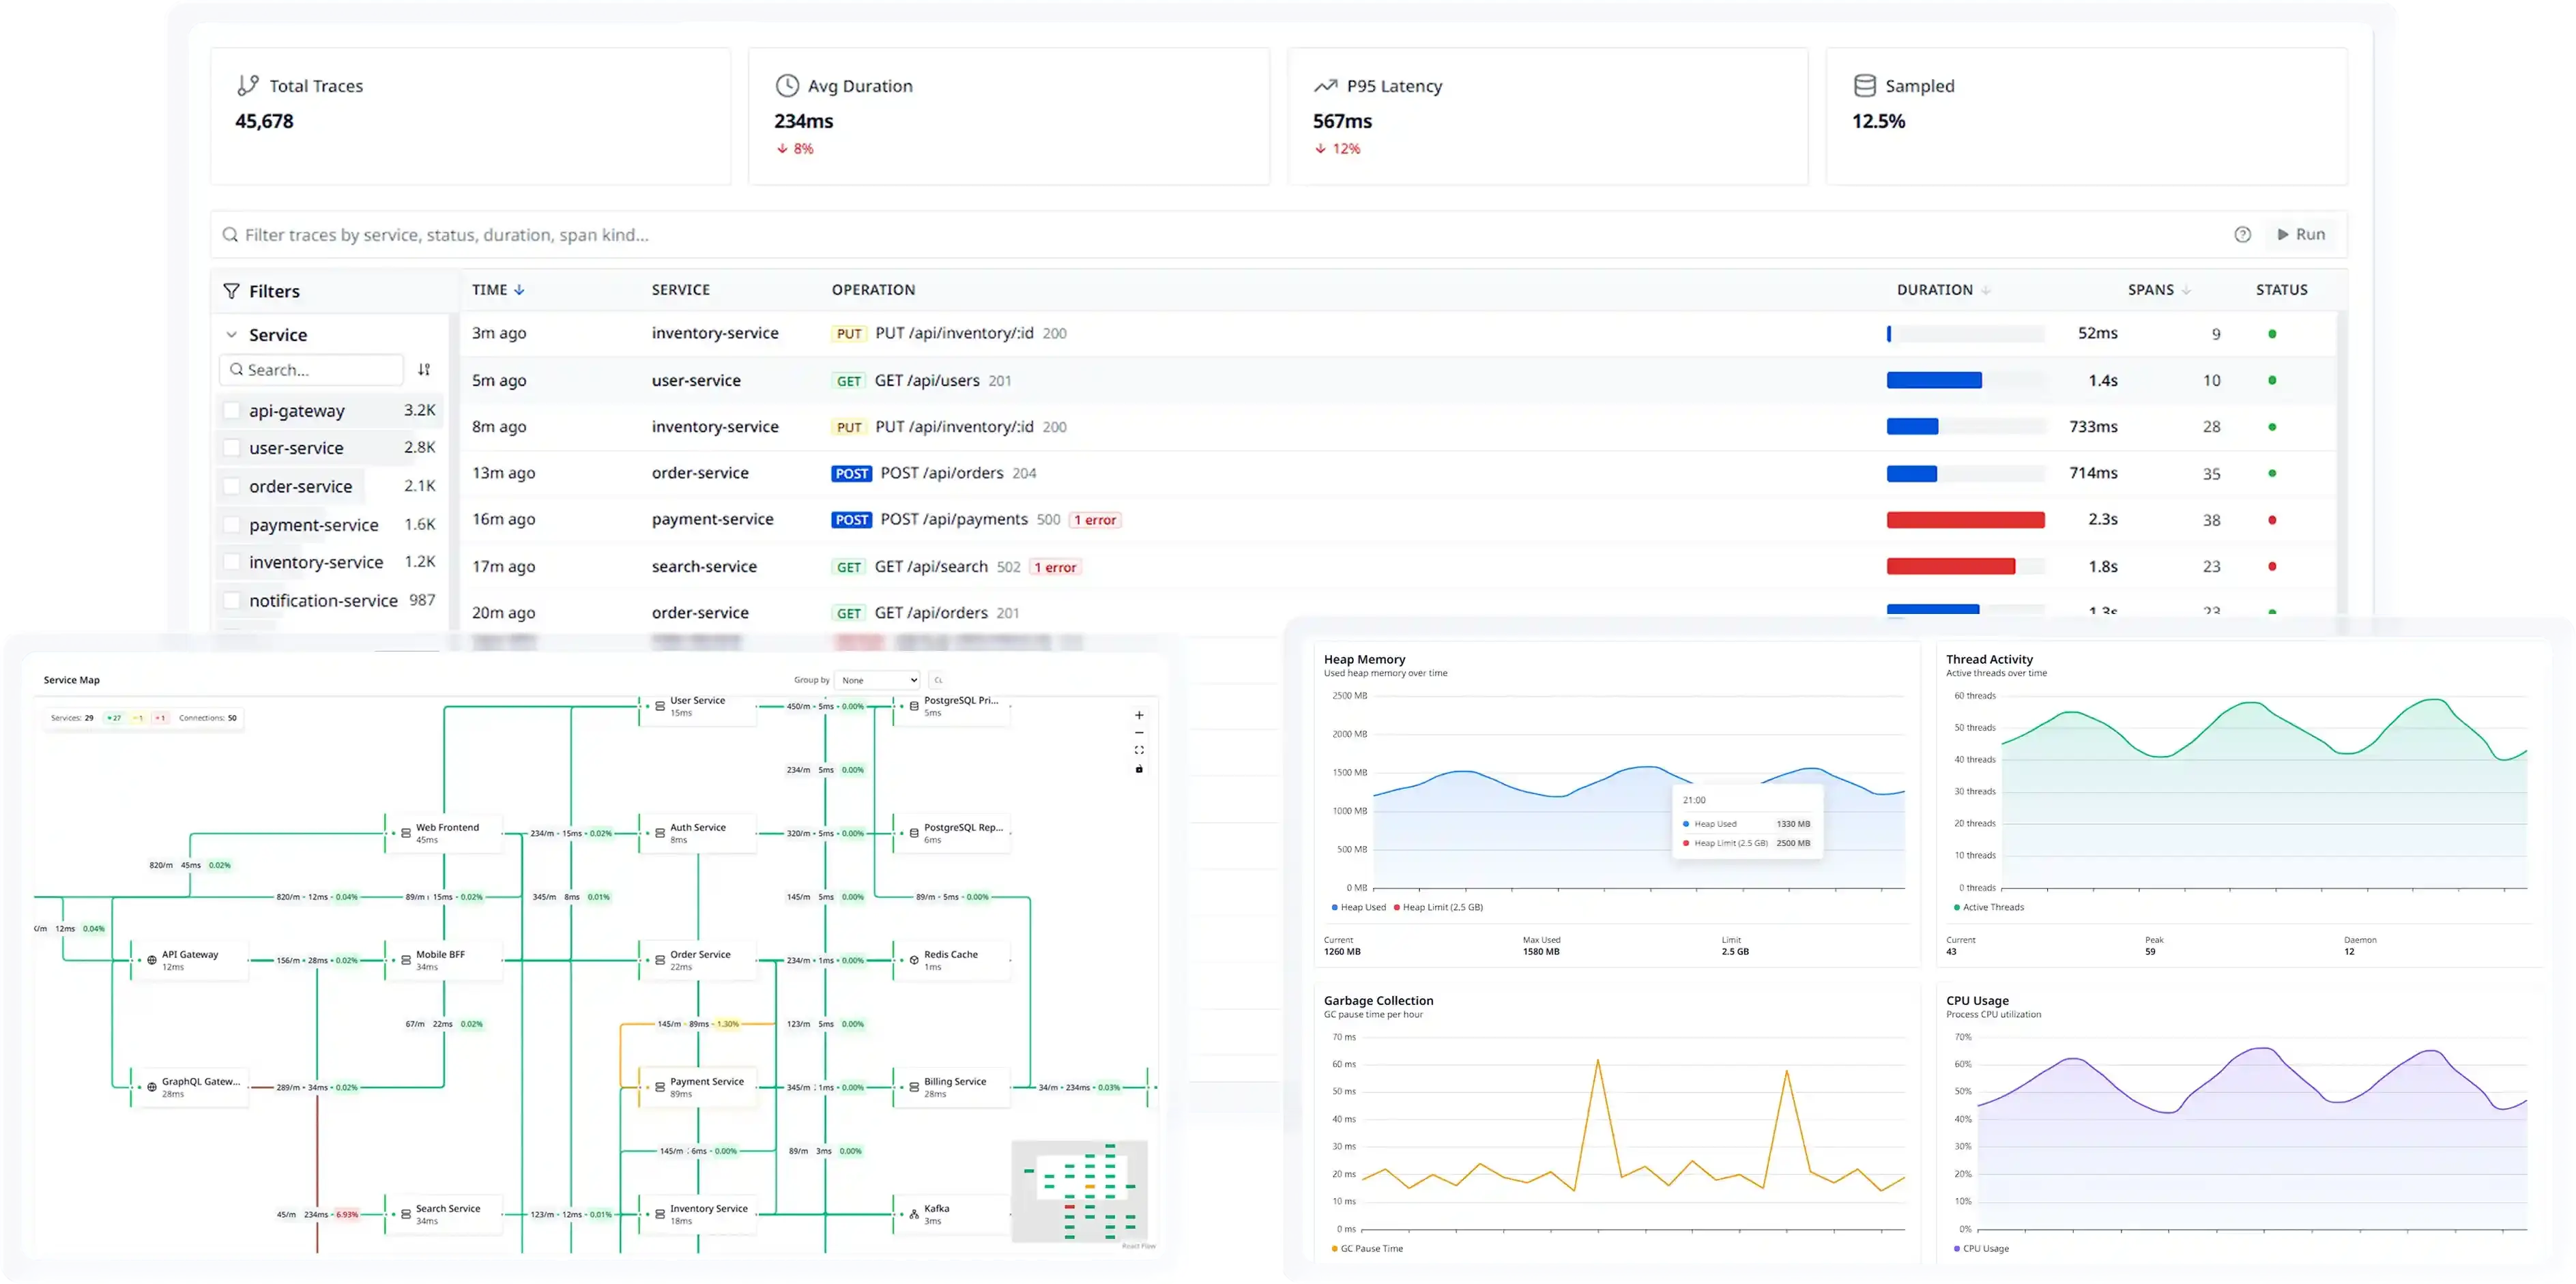
Monitor Every Transaction Before It Becomes a Problem
Get a real-time view of your application's response times, throughput, and failure rates in one dashboard. Atatus breaks down performance by MySQL, PHP, and remote HTTP calls so you know exactly where time is being spent. Track Apdex scores, spot failure spikes the moment they happen, and correlate HTTP error codes to the root cause without digging through logs or guessing.
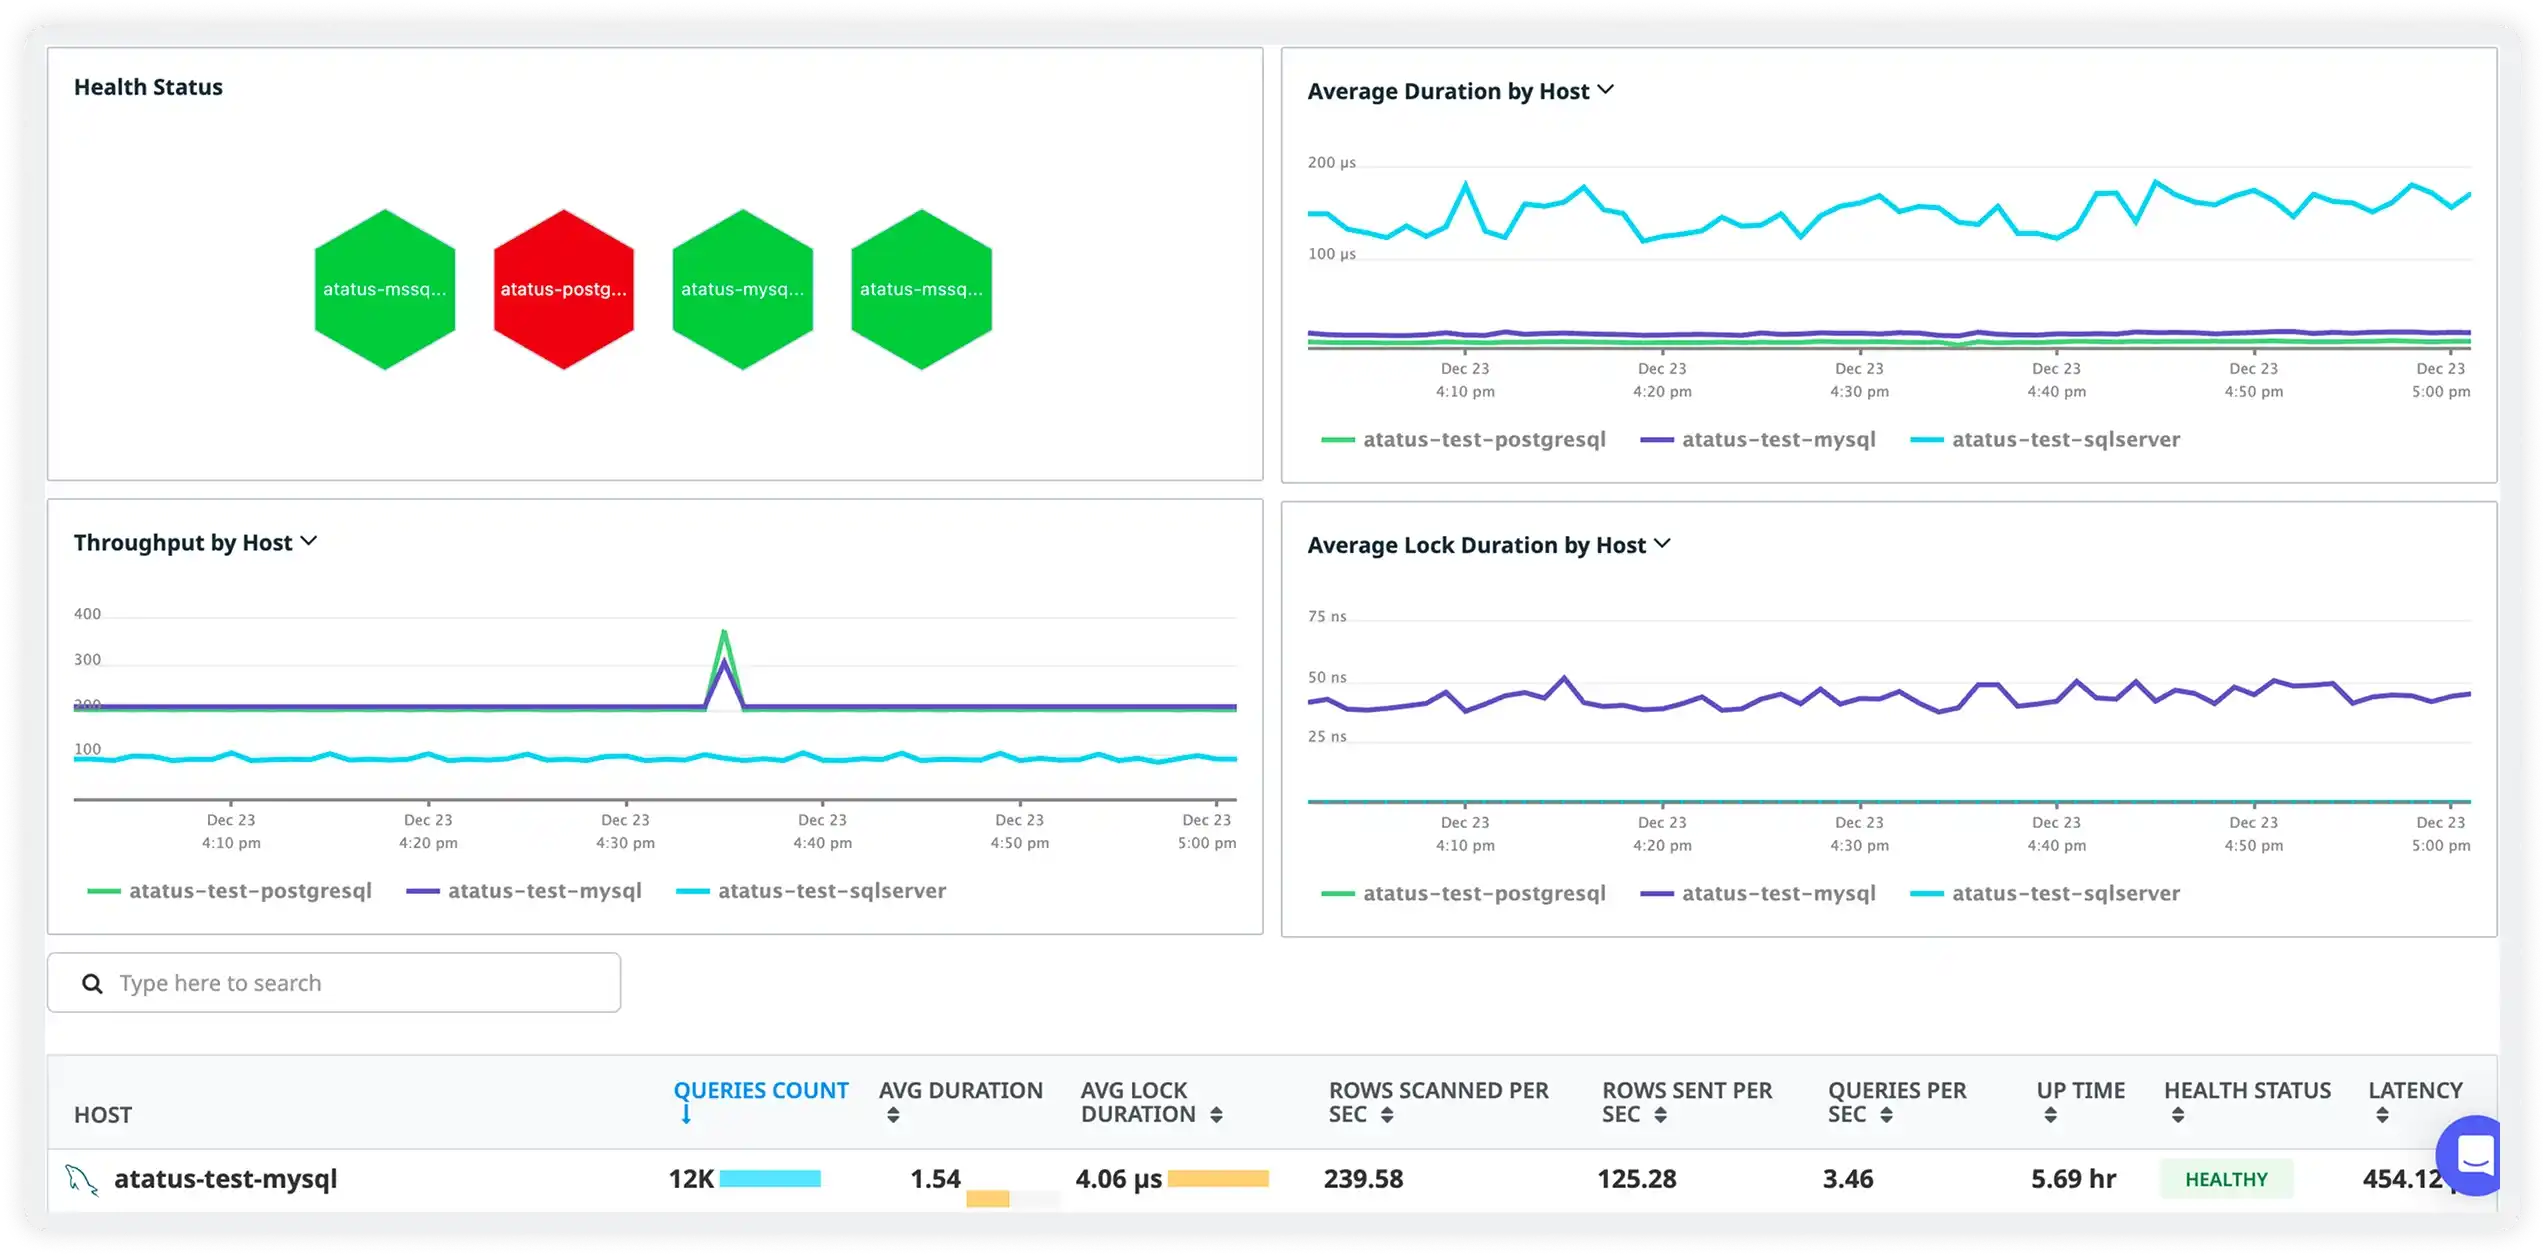
See Every Query Your Database Runs - Down to the Microsecond
Slow queries silently kill application performance. Atatus Database Monitoring gives you a complete activity sample of every SQL statement executed with duration, host, database, user, and wait event group captured in real time. Whether it's a CPU-heavy SELECT or a concurrency bottleneck locking your tables, you get the full picture across all your databases so your team can optimize confidently, not reactively.
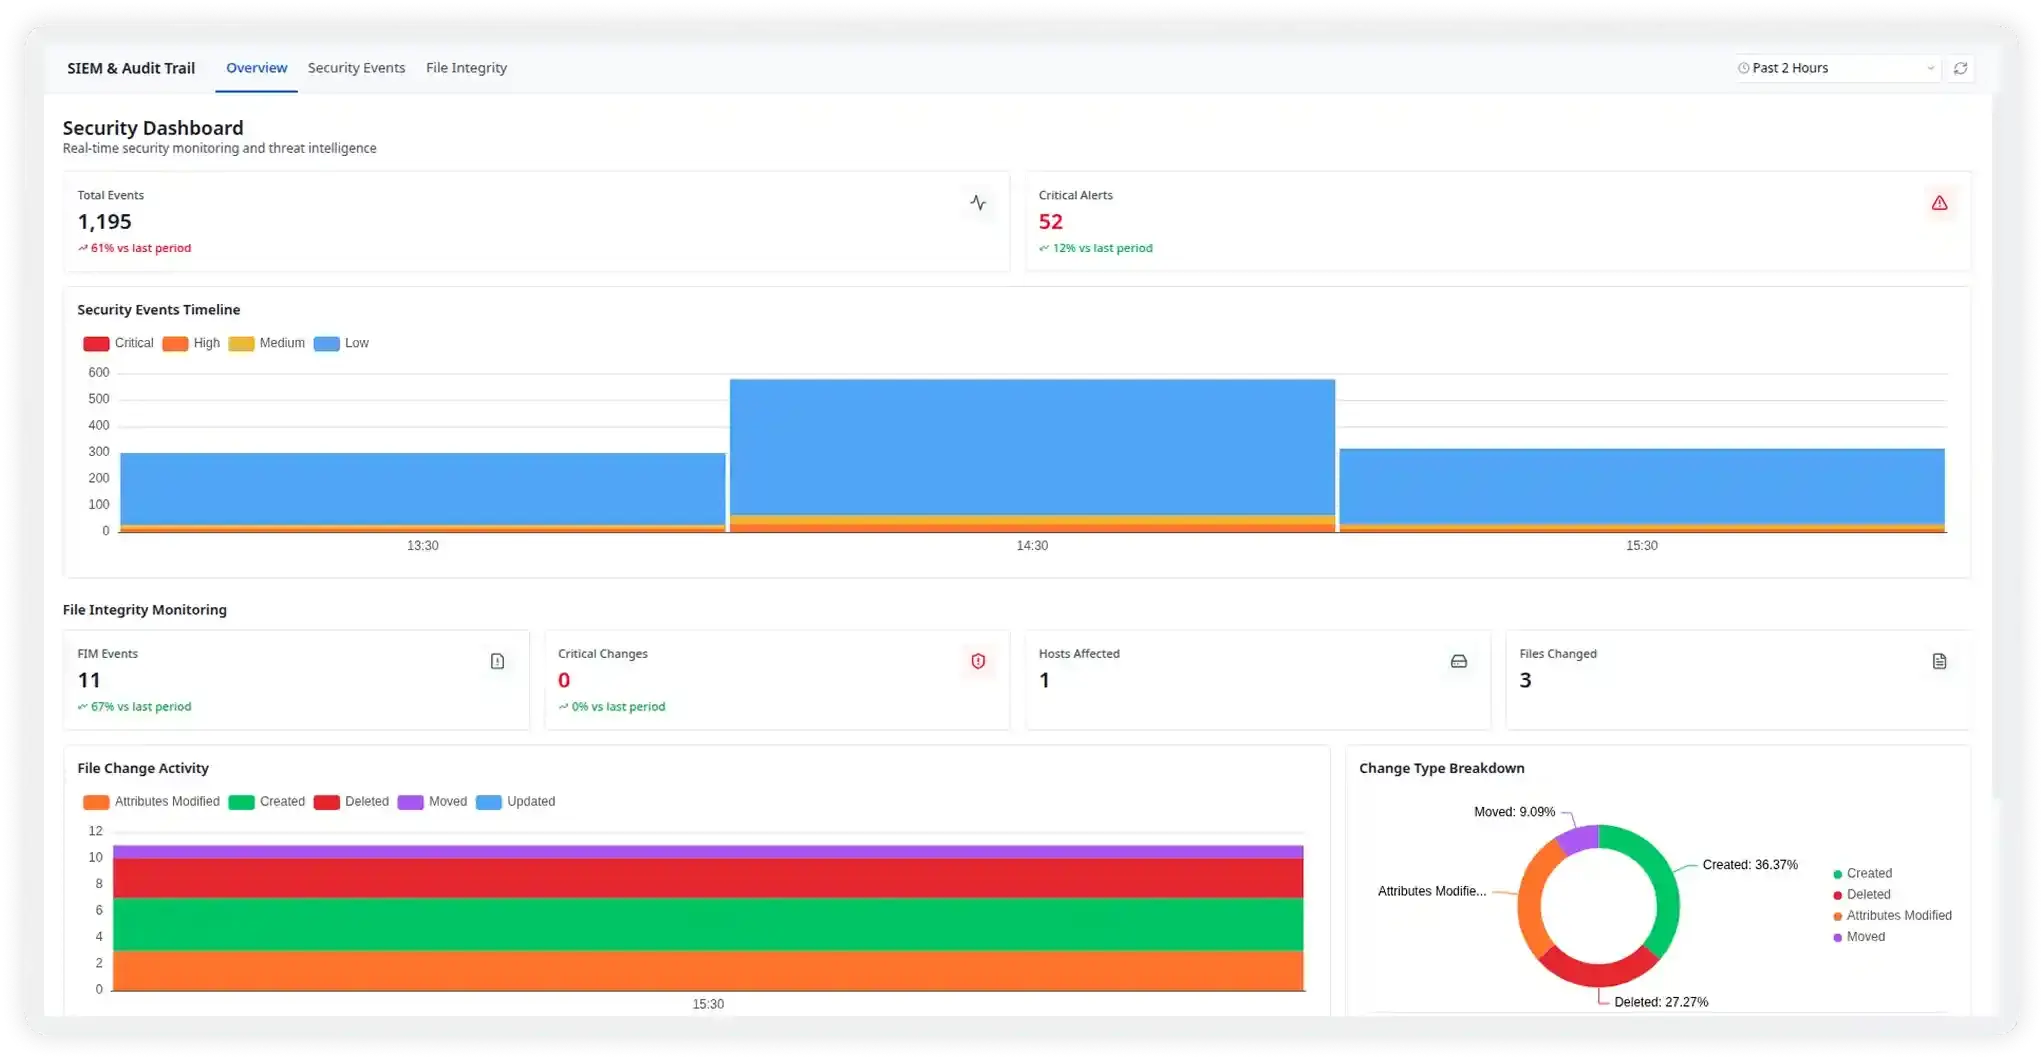
Stay Ahead of Security Threats With Real-Time Event Intelligence
Atatus SIEM & Audit Trail gives your team a live security command center, tracking total events, critical alerts, and file integrity changes as they happen. Visualize security event timelines by severity, monitor file change activity across hosts, and catch unauthorized access or configuration drift before it escalates. From critical alerts to low-severity events, nothing slips through undetected.
Every Product Your Stack Actually Needs

Monitor application performance in real time, pinpoint bottlenecks, and resolve issues faster with end-to-end transaction visibility.
Gain complete visibility into serverless workloads, track function performance, and quickly identify failures across cloud environments.

Analyze API usage, latency, errors, and traffic patterns to ensure reliable, high-performing experiences for every request.

Continuously profile applications in production to uncover CPU, memory, and code-level inefficiencies with minimal overhead.

Monitor servers, containers, Kubernetes, and cloud resources from a single platform to maintain performance and availability.

Track database health, query performance, and resource utilization to detect slowdowns before they impact users.

Monitor network devices, bandwidth, and connectivity metrics to maintain network reliability and prevent service disruptions.

Collect, search, analyze, and correlate logs with metrics and traces to accelerate troubleshooting and root cause analysis.

Detect threats, investigate security incidents, and improve compliance with centralized security monitoring and intelligent alerting.
Your Next Outage Is Already Showing Up in Your Metrics
Let us show you where before your users find out first.
Request a demo Follow us on LinkedInWhy Engineering Teams Choose Atatus?
Atatus combines deep observability with actionable insights, so your team can detect, diagnose, and fix issues at speed.

Surface errors the moment they occur, complete with stack traces, affected users, and reproduction steps.

Keep tabs on CPU, memory, disk, and network health across all your servers. Spot resource pressure before it crashes your app.

Filter out sensitive user data before it ever reaches Atatus. Stay compliant with GDPR, SOC 2, and your own internal policies.
Let Atatus surface anomalies and performance trends automatically, so your team focuses on fixing, not finding.

Get notified the moment something goes wrong before it becomes an outage. Set thresholds that actually matter to your team.
Deploy Atatus wherever your infrastructure lives, including cloud, hybrid, or fully on-premise. You stay in control.

Built with data privacy in mind. Control what gets tracked, filter sensitive data, and stay compliant from day one.
Build the views your team actually needs. Surface the metrics that matter most to your product, ops, and engineering leads.

Follow a request across every service and microservice. Understand latency at every hop, not just at the surface.

Atatus is a great product with great support. Super easy to integrate, it automatically hooks into everything. The support team and dev team were also very helpful in fixing a bug and updating the docs.

Frequently Asked Questions

All-in-one full stack monitoring
Get a complete view of your application, servers, containers, logs and metrics, and optimize performance with powerful insights.