
 KLogic
Advanced AI-Powered Kafka Monitoring
KLogic gives DevOps and SRE teams complete visibility into every Kafka cluster for real-time broker health, consumer lag, producer throughput, and AI-powered anomaly detection to fix issues in minutes.
Complete visibility across every layer of your Kafka infrastructure

Cluster Health Monitoring
Real-time broker status, partition distribution, and under-replicated partition detection with predictive failure scoring. Know your cluster health before your users notice a problem.

Consumer Group Monitoring
Track consumer lag per group, partition, and topic in real time. Get intelligent rebalancing recommendations and instant alerts when lag crosses business-critical thresholds.

Custom Dashboards & Advanced Analytics
Build dashboards tailored to your team's workflow with drag-and-drop widgets, real-time metrics, and collaborative sharing. Ops, Dev, and Leadership views from the same data source.
Kafka Connect Monitoring
Track connector health, task failures, and data pipeline throughput across your entire Connect cluster. Automated troubleshooting recommendations surface connector misconfigurations before they stall your pipelines.

Config Change Tracking & Audit Logs
Every broker configuration change, topic modification, and ACL update is logged, timestamped, and searchable. Prove compliance, trace root causes, and roll back with confidence.

Producer Performance Monitoring
Track producer throughput, batch sizes, compression ratios, and retry rates in real time. Identify bottlenecks upstream before they affect downstream consumers and trigger SLA breaches.
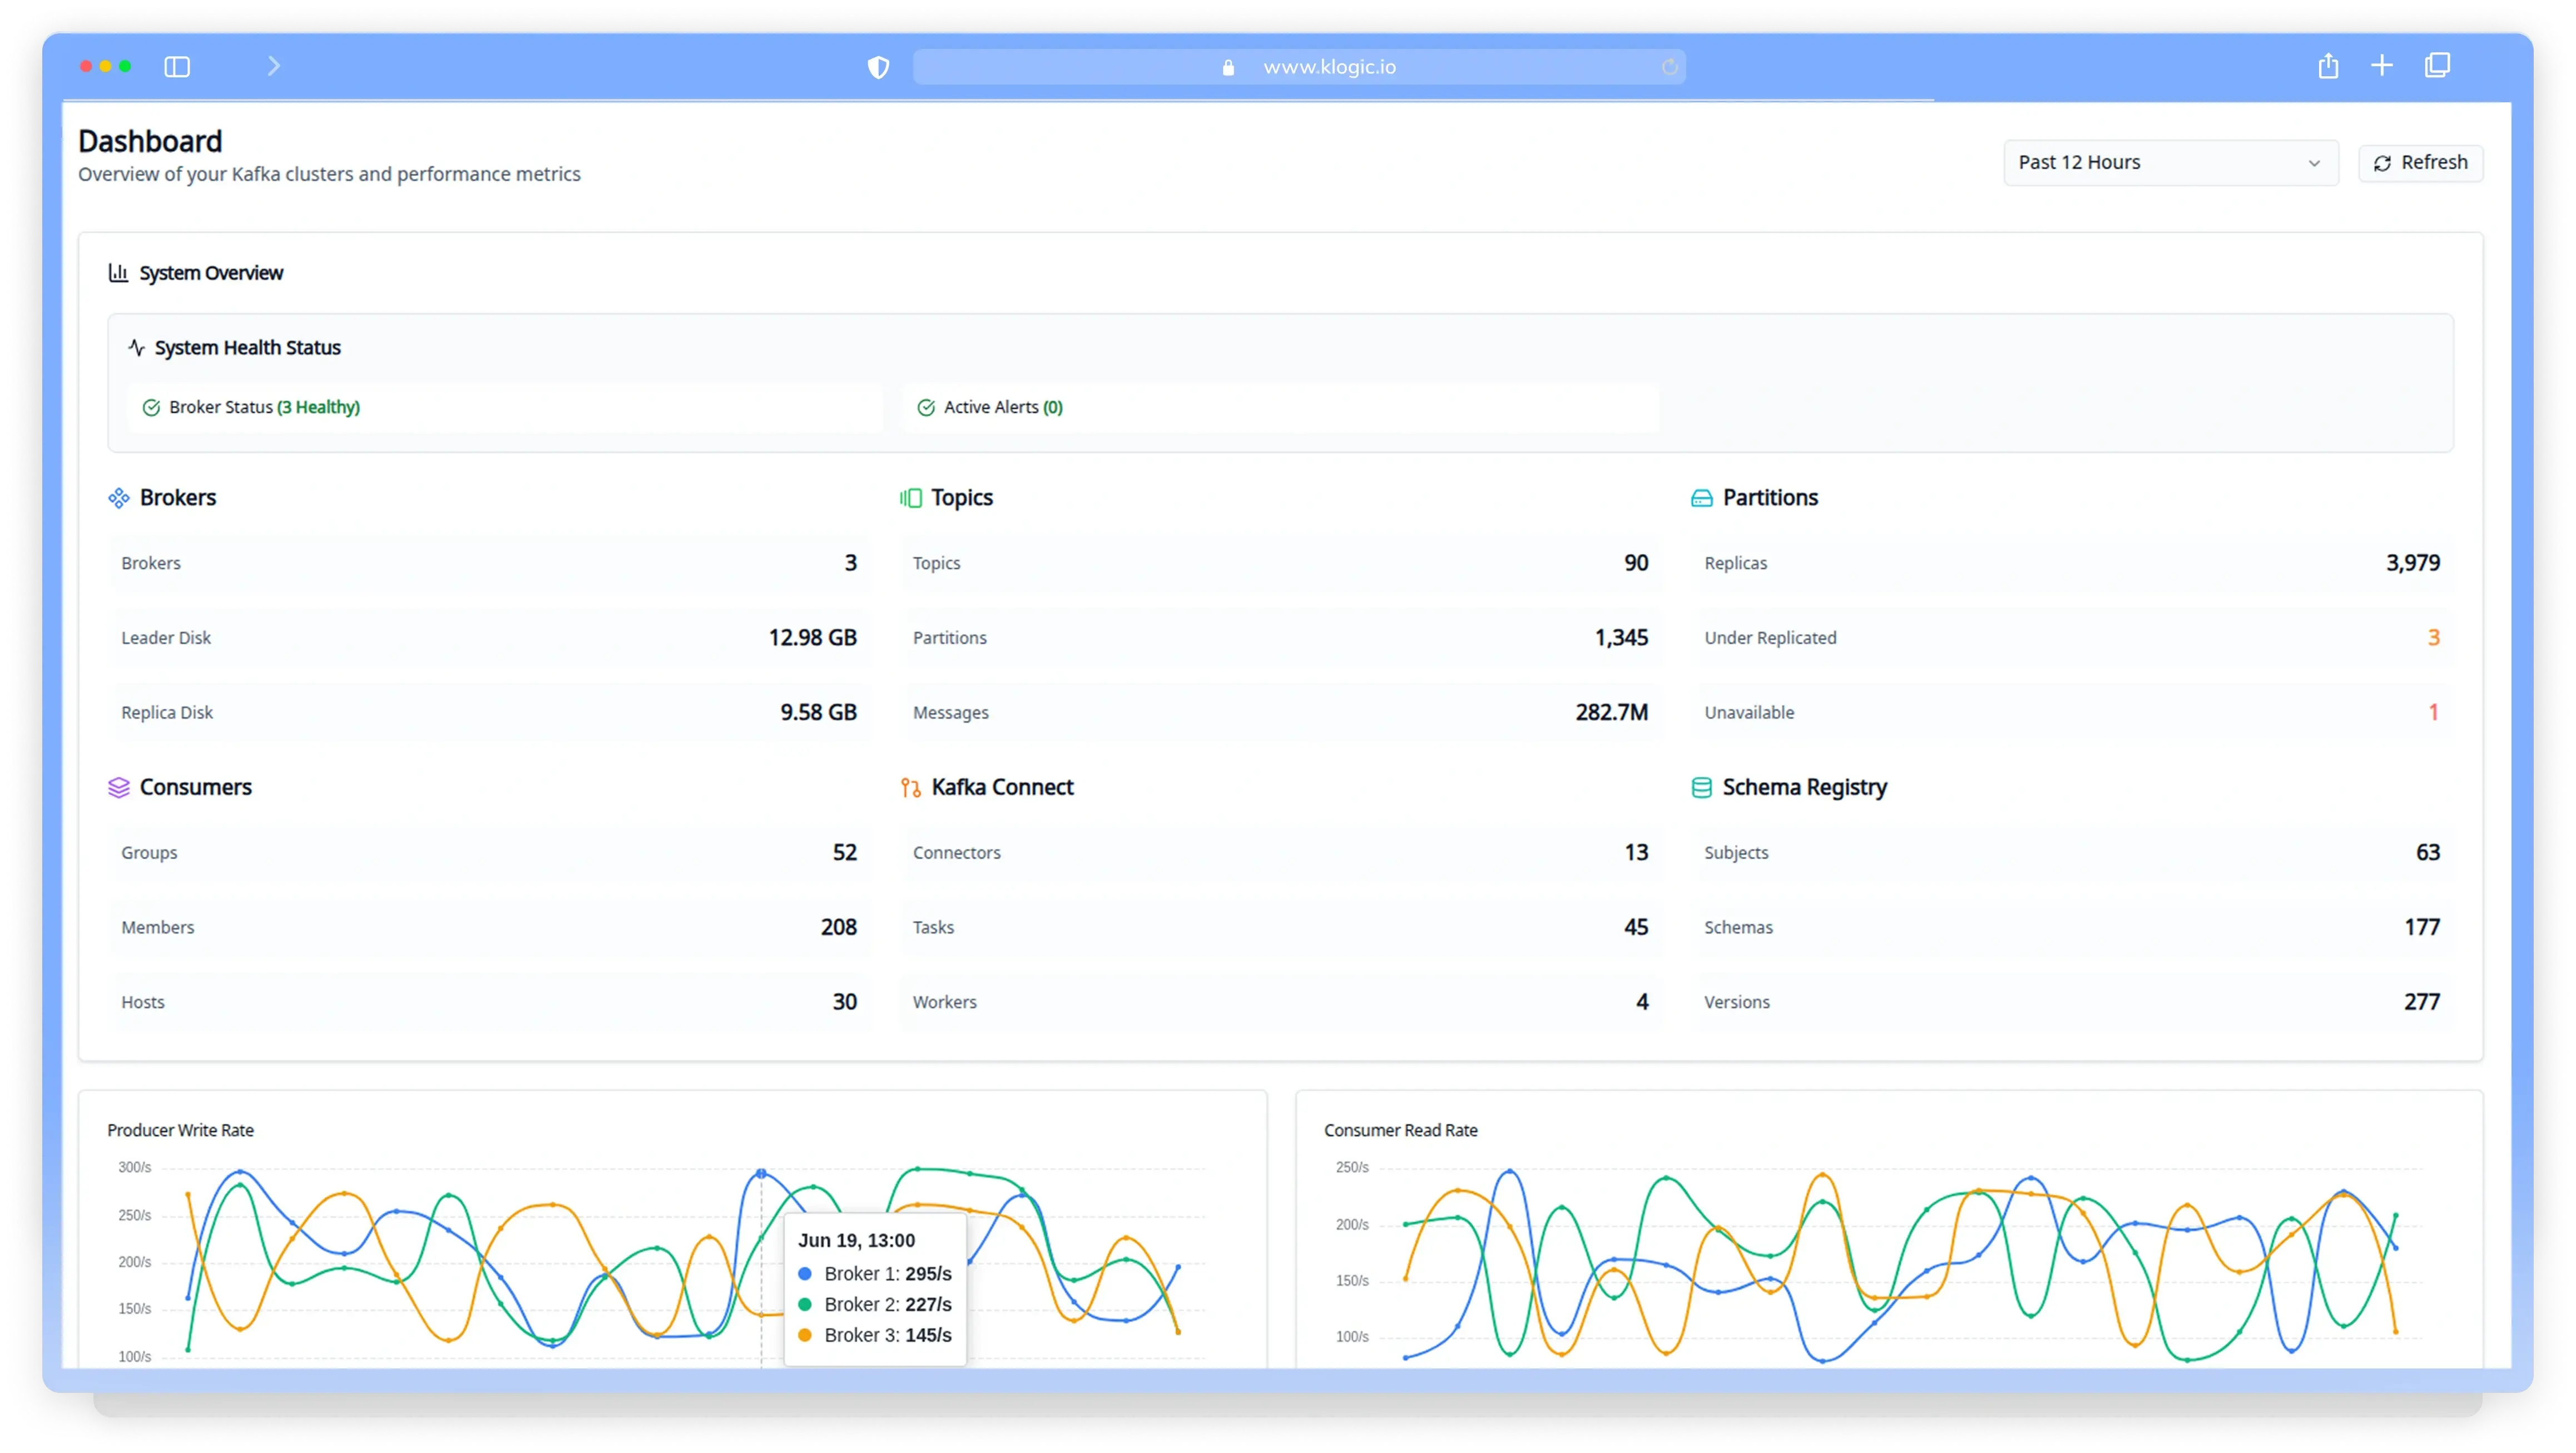
Every Kafka Metric In One View
Brokers, topics, partitions, consumers, connectors, and schema registry surfaced in a single dashboard. Know your broker health status, spot under-replicated partitions, and track producer write rates and consumer read rates across every broker in real time. No more jumping between tools to get a complete picture of your cluster.
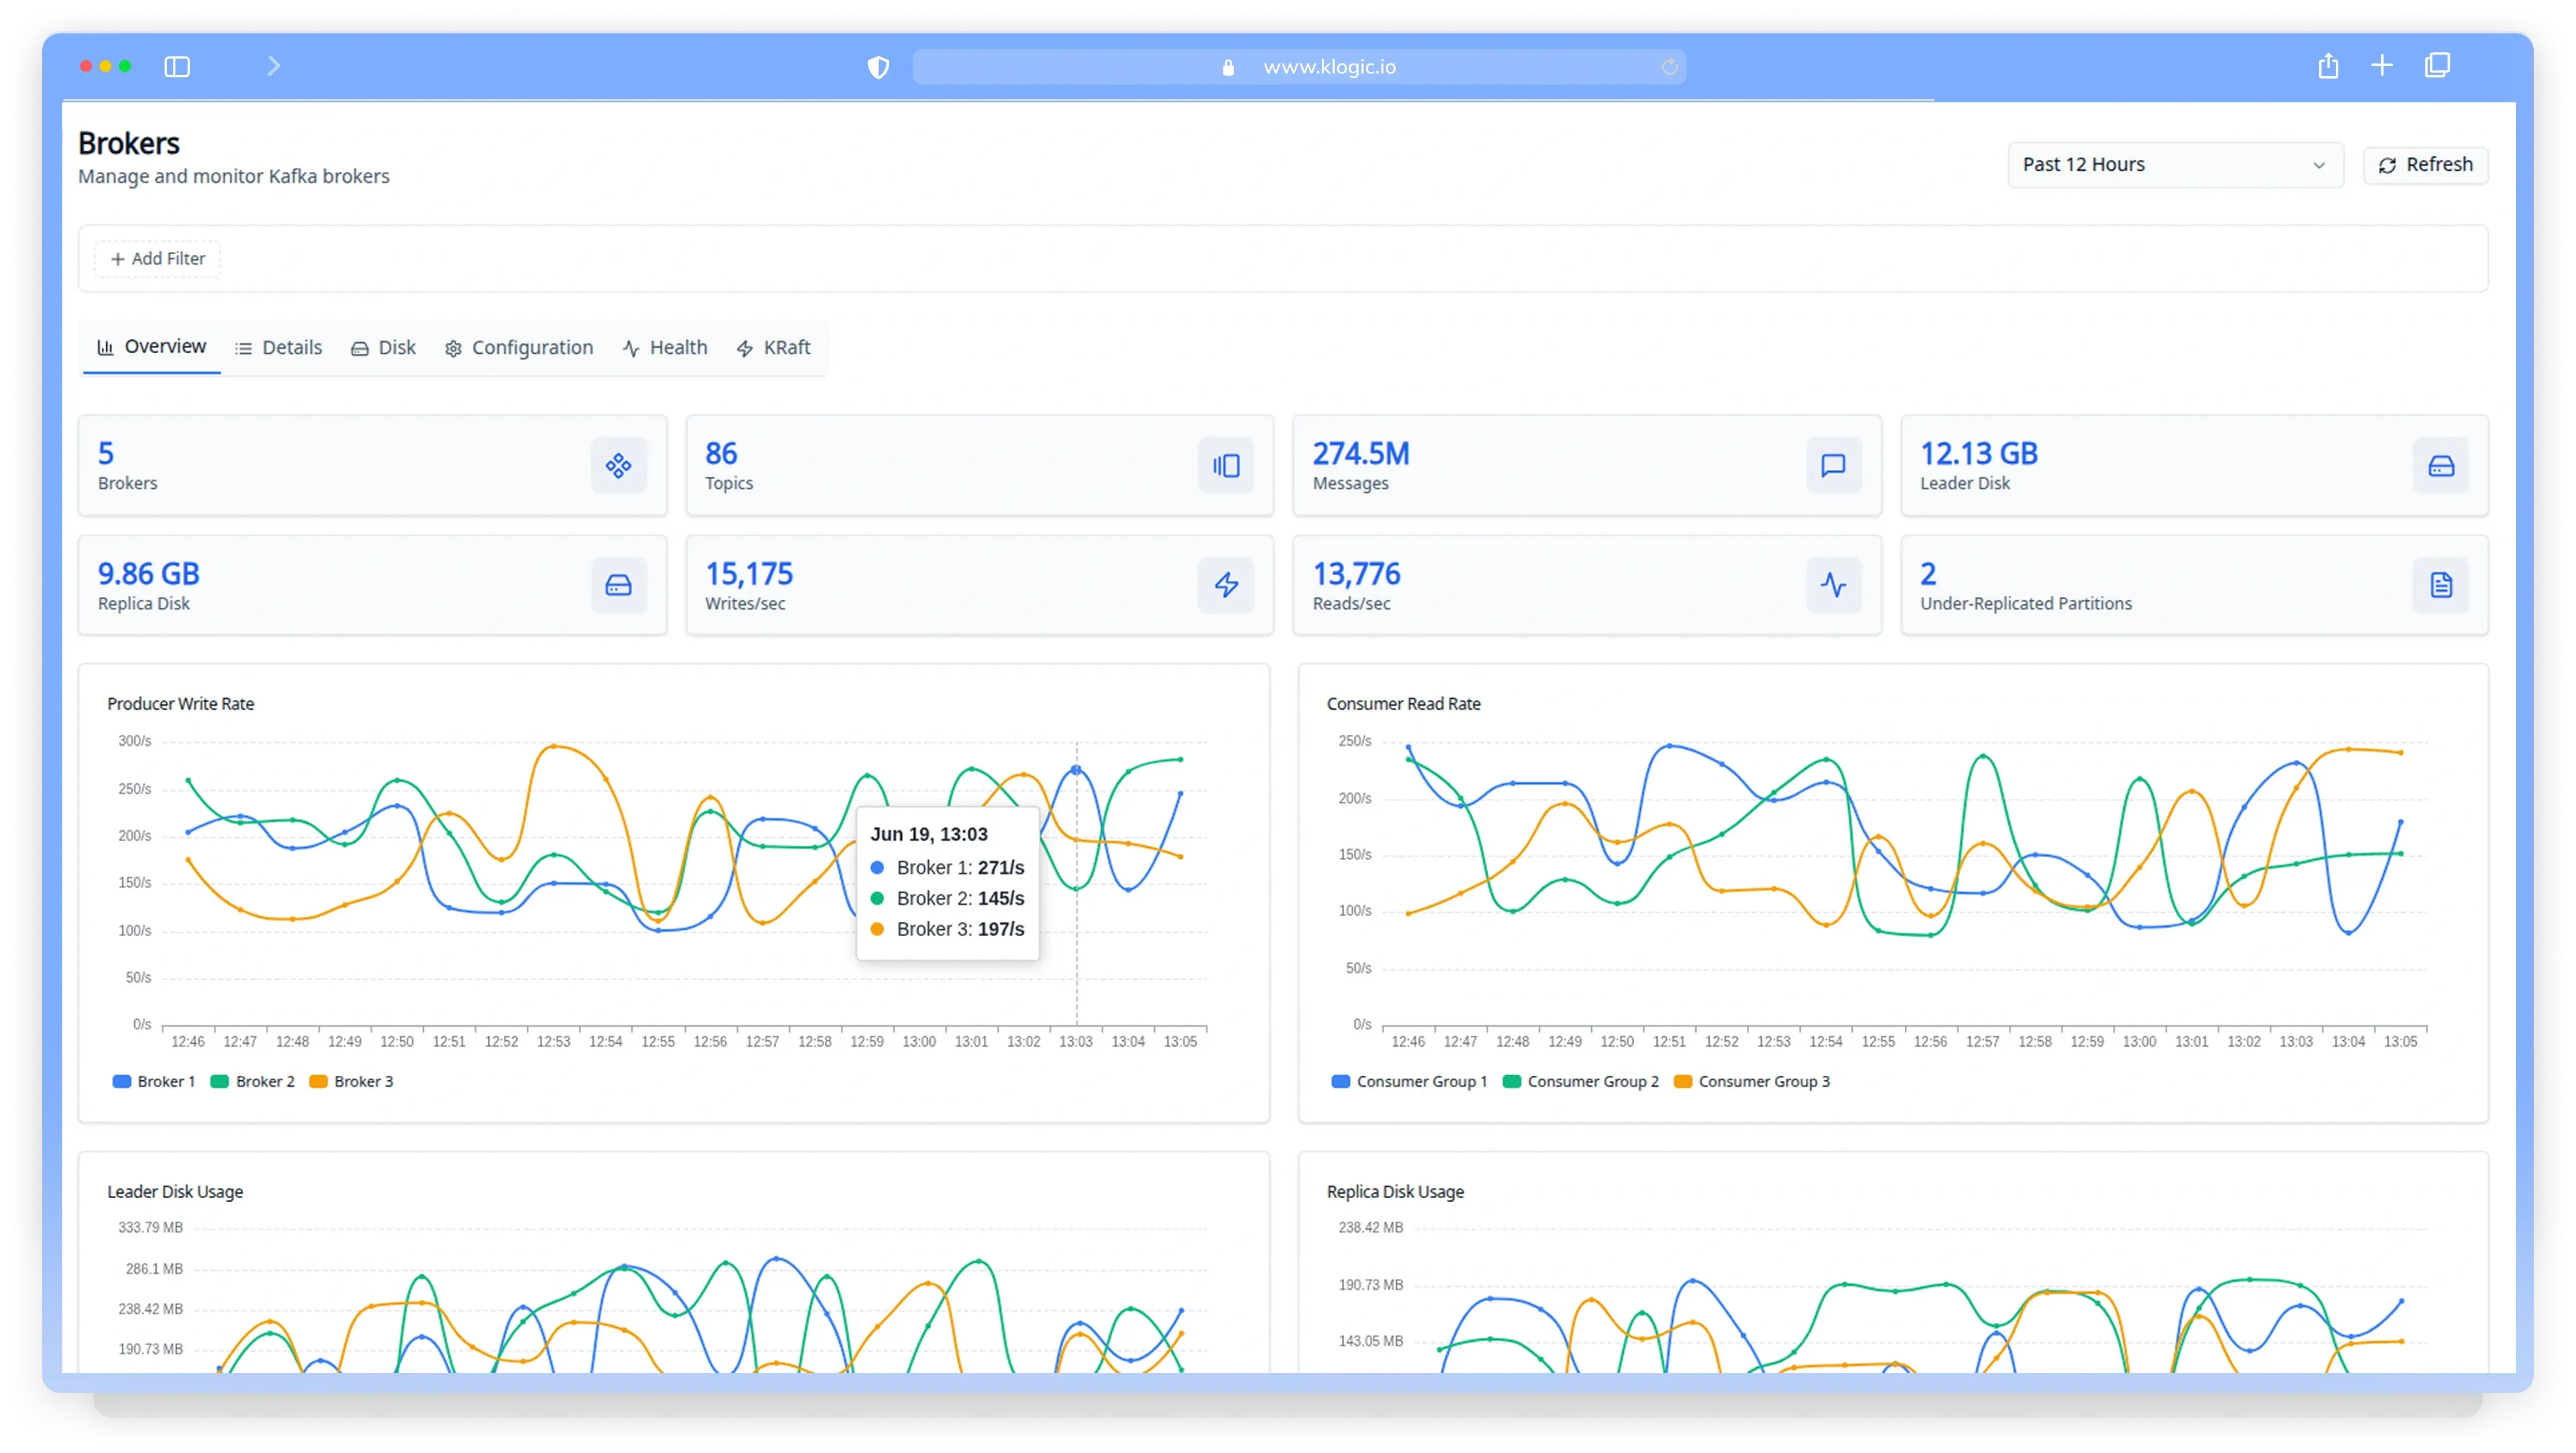
Broker-Level Detail, Not Cluster-Wide Averages
Track every broker's write rate, read rate, disk usage, and partition health without guessing which one is under pressure. Klogic breaks down leader disk, replica disk, writes per second, and under-replicated partitions per broker, not just in aggregate. Spot the outlier before it becomes a bottleneck.
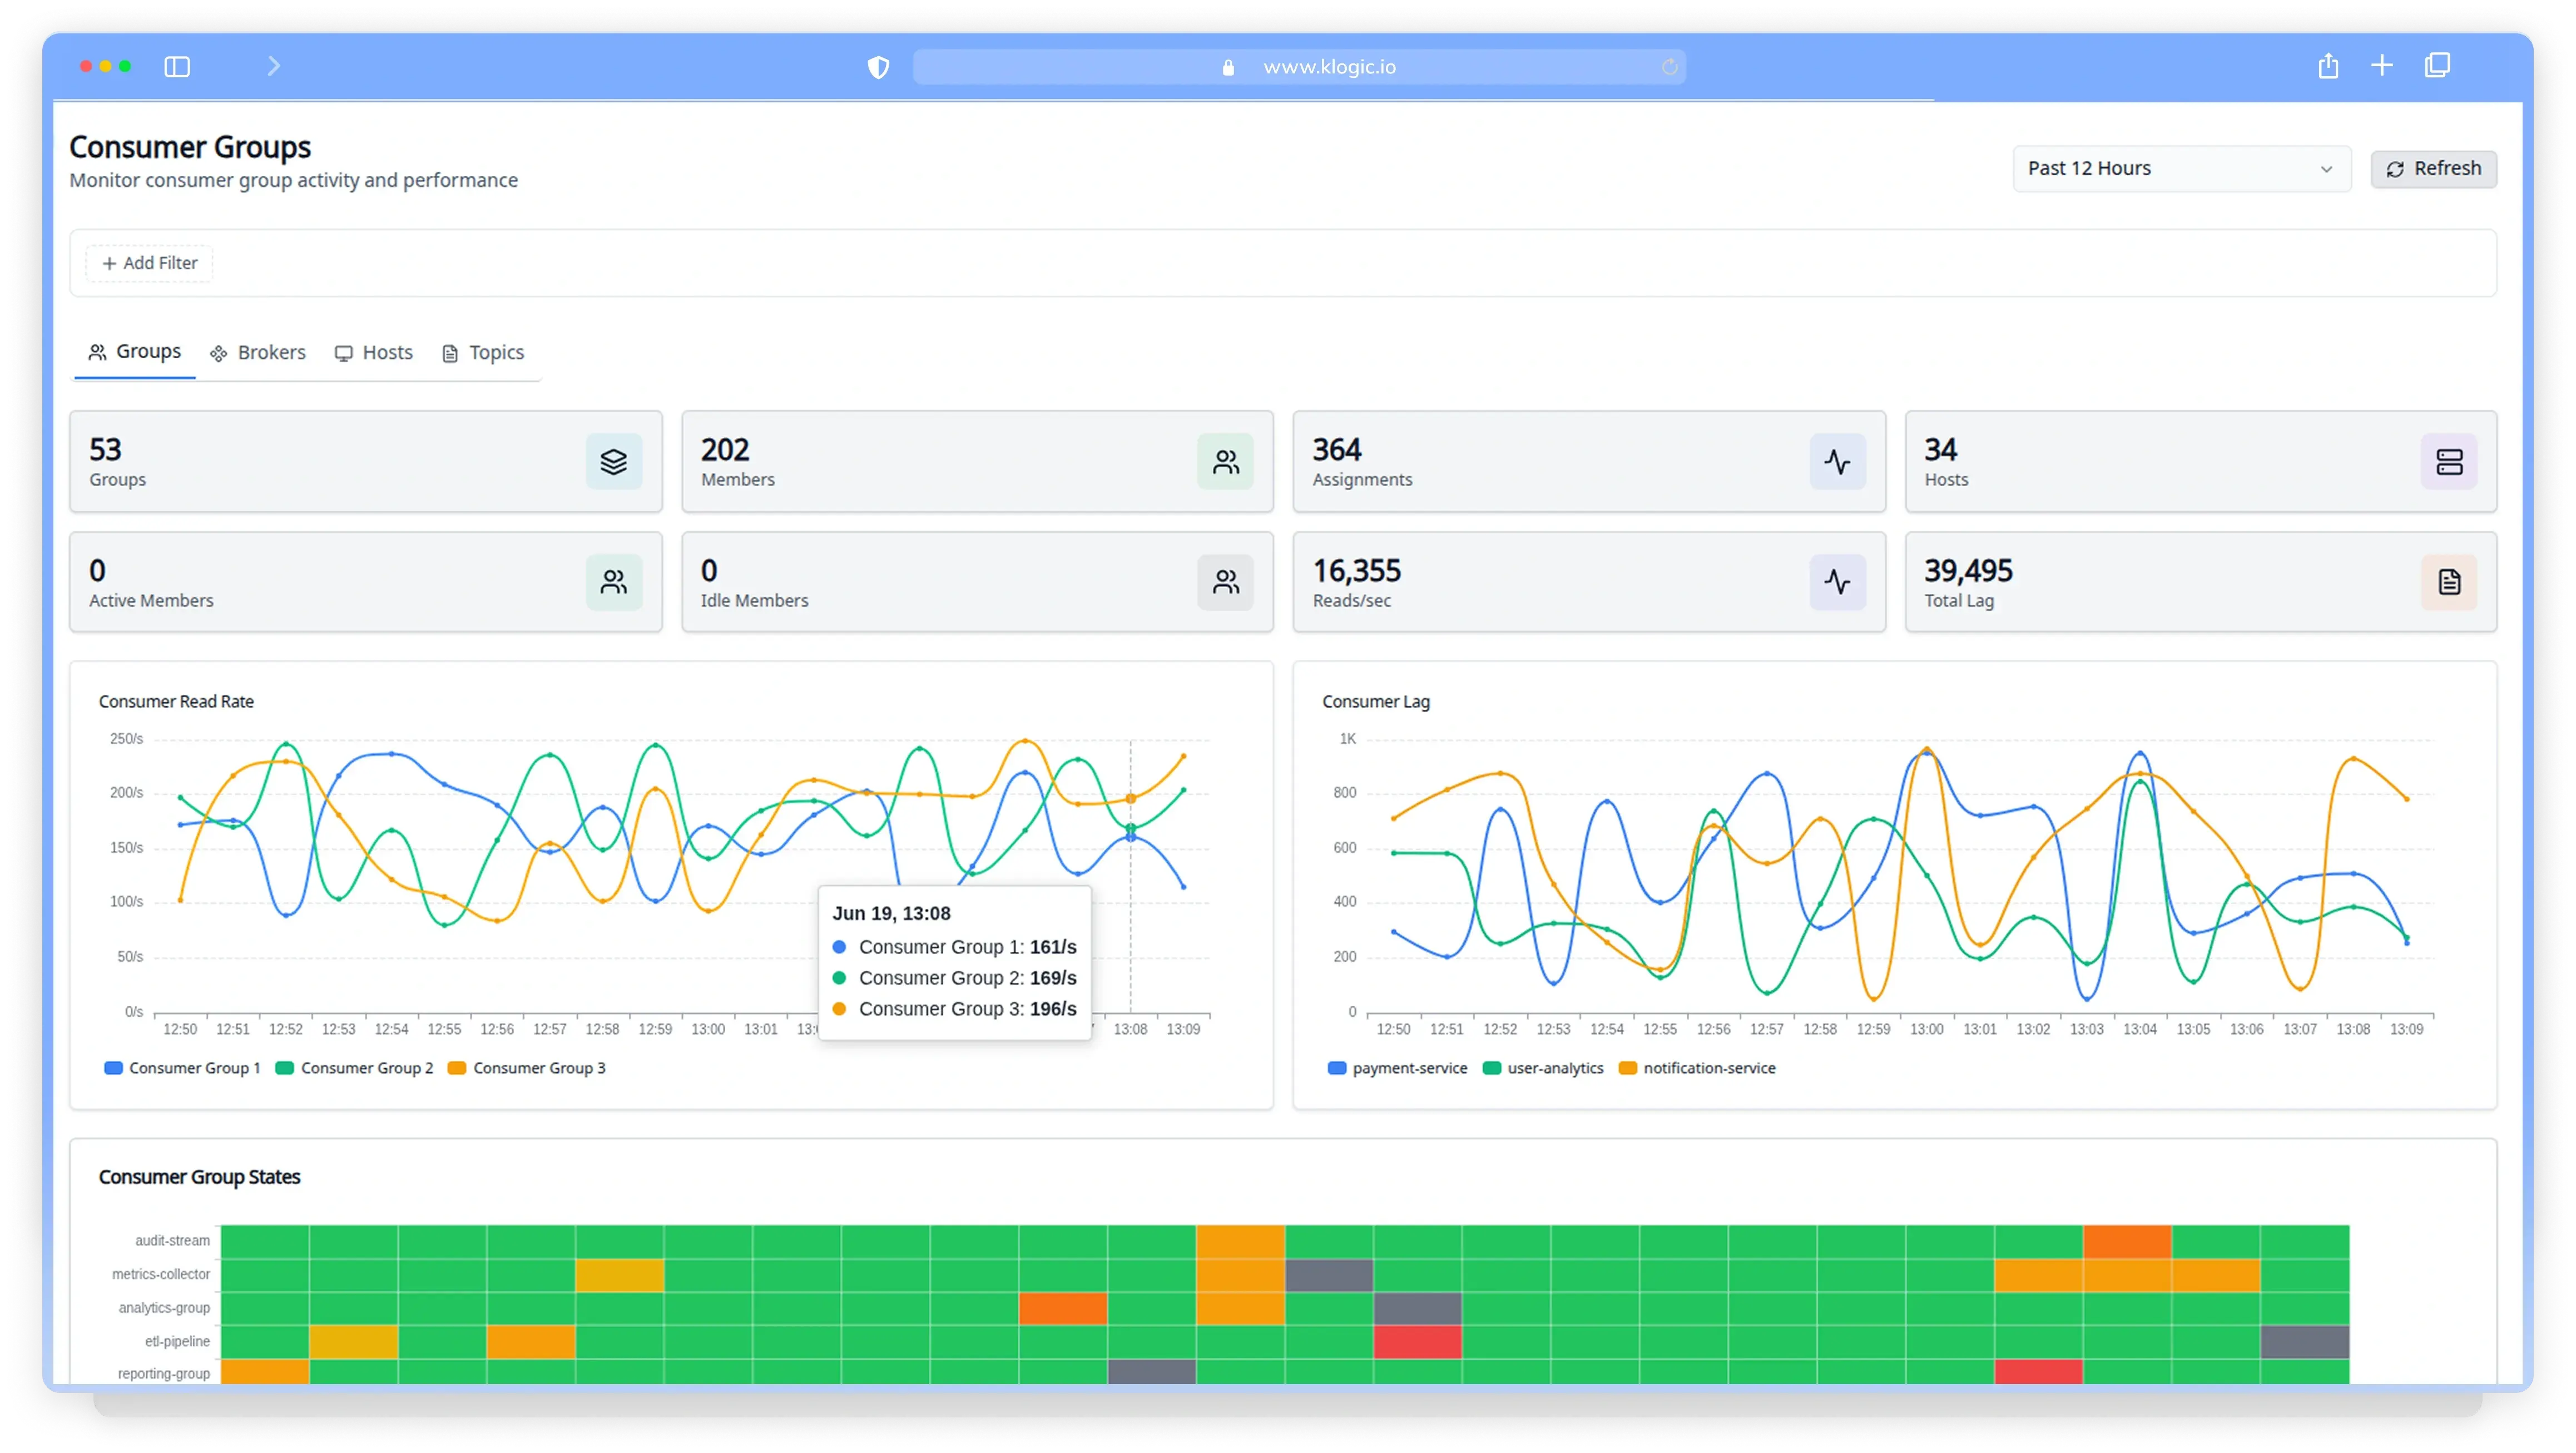
Know Which Consumer Is Lagging Before Your Pipeline Does
Consumer lag is where Kafka pipelines silently break. Klogic tracks read rates, lag trends, and consumer group states across every partition, including payment-service, user-analytics, and notification-service, so you know exactly which group is healthy and which one needs attention right now.
Improve Your website user experience In Easy Steps

 Monitor Kafka clusters with complete visibility.
- Track consumer lag and broker performance.
- Resolve issues before they affect applications.
- Keep streaming pipelines running smoothly.

- Gain end-to-end visibility into event streams.
- Detect bottlenecks and processing delays instantly.
- Improve reliability with proactive alerts.
- Optimize performance across cloud workloads.

Quickly identify Actionable insights to resolve performance bottlenecks and exceptions.
- Spot anomalies before they become threats.
- Detect fraudulent patterns in real time.
- Accelerate investigations with actionable insights.
Your Next Outage Is Already Showing Up in Your Metrics
Let us show you where before your users find out first.
Request a demo Follow us on LinkedInWhy Engineering Teams Choose Klogic for Kafka Monitoring?
Monitor every broker, topic, partition, and consumer from a single place, without stitching together multiple tools.
Get a single view of brokers, topics, partitions, consumers, connectors, and schema registry in one place.

Monitor producer write rates, consumer read rates, leader disk, replica disk, and under-replicated partitions.
Track read rates and lag trends across every consumer group and partition. Catch falling-behind consumers before they stall your pipeline.
See every connector's status, such as running, failed, or paused, along with task-level timelines so nothing in your data pipeline goes unnoticed.

Get notified the moment a broker goes unhealthy, a consumer falls behind, or a connector fails via Slack, PagerDuty, Email, or Teams.

Drill into individual topics, partitions, and consumer group states with filters that surface exactly what's broken, not everything at once.

Track writes per second and reads per second over time, per broker and per consumer group, so you spot throughput drops before they escalate.

Connect Klogic to your existing Kafka infrastructure in minutes. Lightweight integration with no changes to your producers or consumers.

Shared dashboards and alerts across your entire engineering team. Everyone sees the same data, at the same time, without extra configuration.

KLogic made it much easier to understand what was happening across our Kafka clusters. The dashboards are intuitive, and the AI-powered insights helped us identify consumer lag issues before they affected production.