Application Performance Monitoring
Atatus gives you real-time visibility into your application's performance, as well as detailed transaction details, slow database queries, poorly performing network calls, and more. Identify root causes and resolve issues more quickly.
With Atatus, You Can…

Exceptions
Detect issues prior to release with minimal effort and address them. This will assist you in making production more quickly.

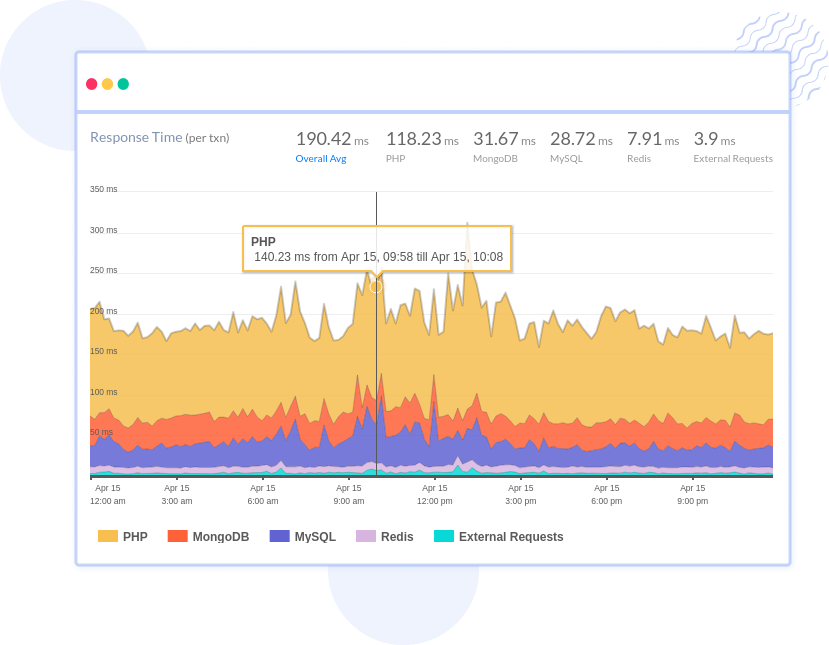
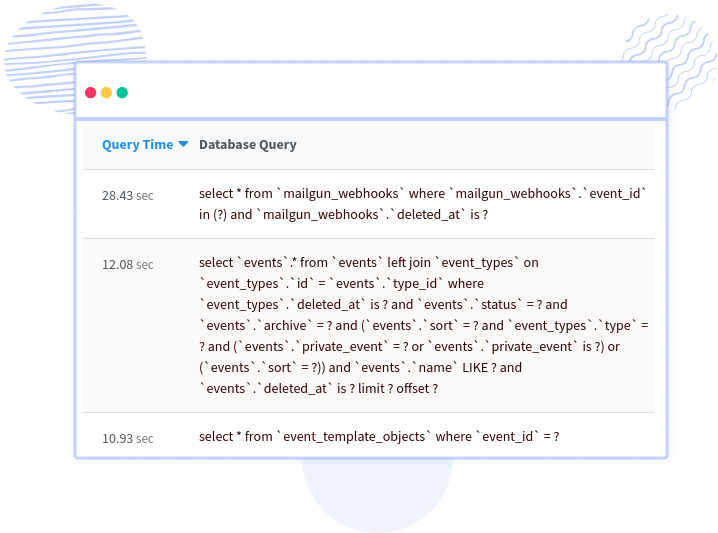
Slow DB queries
Explore how your SQL and non-SQL queries are performing in your application with the help of the database monitoring.

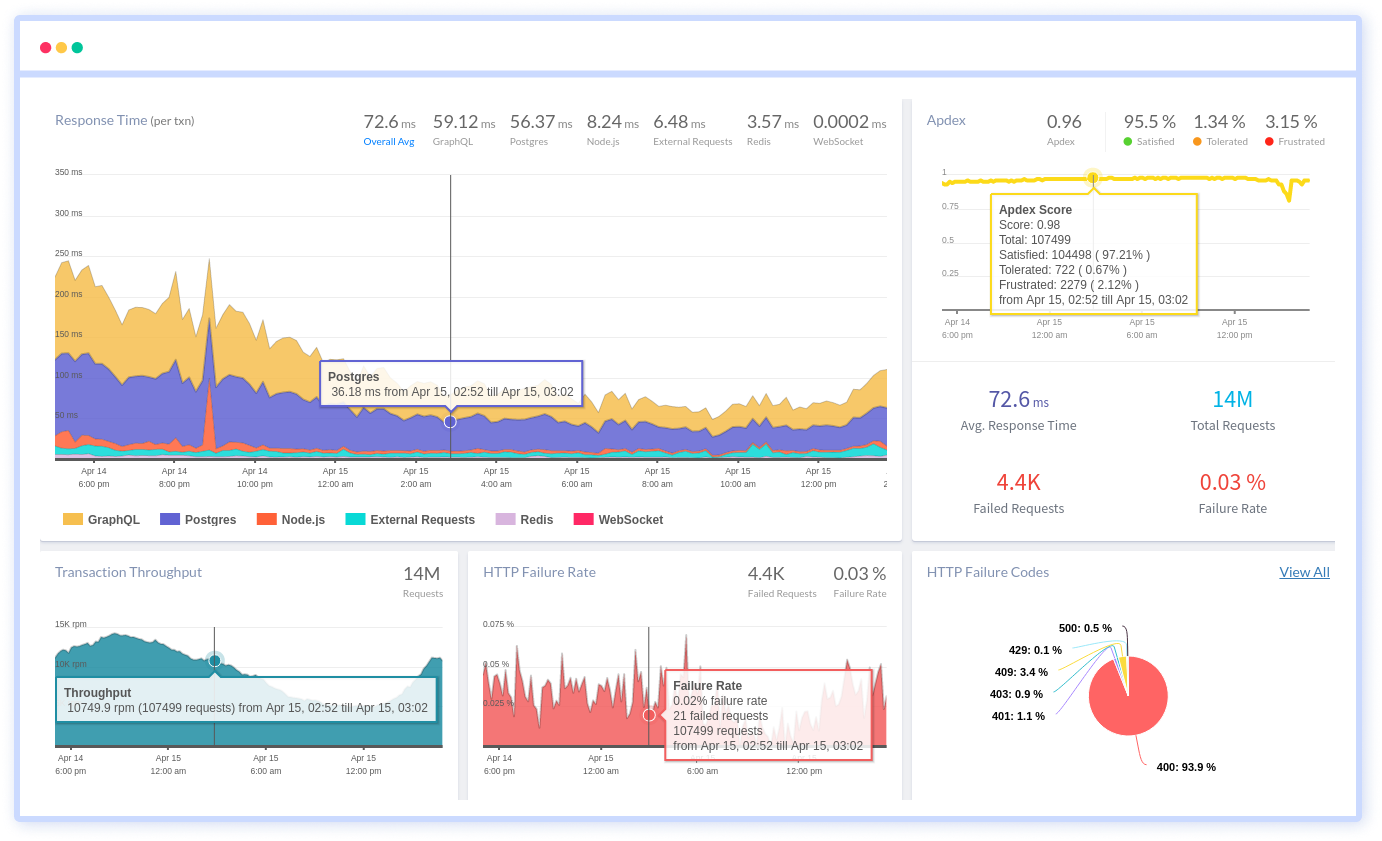
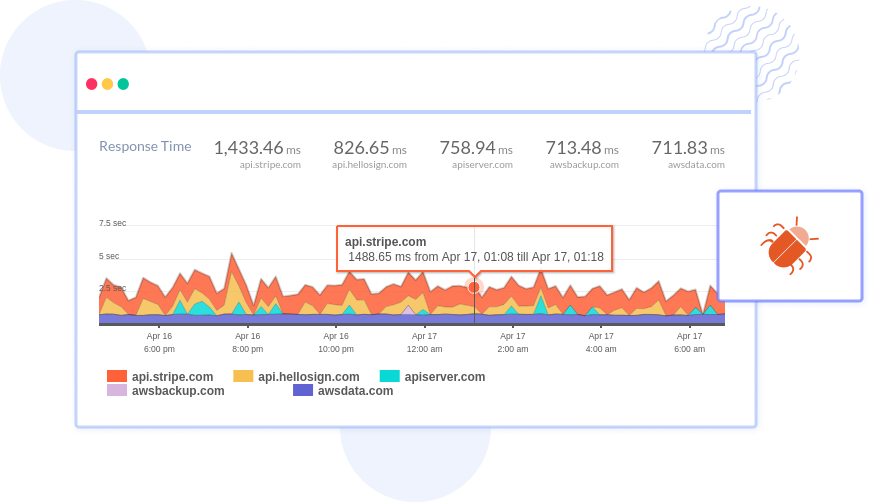
HTTP Failures
Know the reasons behind performance breakdowns and identify the main causes of these HTTP failures with throughput, failure rate, and exception rate.

Session Traces
Uncover callbacks in your JavaScript code that are implemented slowly and prevent subsequent calls on the browser's major thread from being executed.

Slowest Requests
Determine accurate endpoints the requests correspond to, as well as a breakdown of exactly why the request was loading slowly.

Runtime Metrics
Spot deviations in the parameters of the baseline model, reflect the relationships between risk factors.
Get a complete picture of your application performance
All-in-one solution
 Drill down into errors and get complete app visibility such as front-end, back-end, server, database, and much more.
- Enhance your digital end-user experience to boost productivity and maximize the revenue of your organization.
- Grasp knowledge across your full-stack application and get precise answers about each potential issue.
Instant code level tracing
- Find out which line of code takes up a lot of processing time and is slowing down your application.
- Take a broad view of your entire code to resolve issues and meet your target outcomes with no struggle.
- Avail of agile solutions to deliver the best product to your customers with the help of metrics, such as min, max response time, throughput, exceptions, and failure rate.
Streamline API issue resolution
- Revamp your application code, such as poor performing SQL queries, slow transactions, hidden API failures, and much more.
- Determine what's impacting your key business metrics and pinpoint each API issue from third-party API issues down to the code level.
- Evaluate the performance, availability, response, and functional correctness of every API to identify the outrages and poor-performing APIs.
Monitor code deployments
- Identify any issues before your customers notice them by collecting metrics about the performance of your new release.
- Discover the performance spike causing downtime in your application by comparing the performance of specific versions.
- Empower DevOps teams to monitor their code on their own from development through production.
Get a complete picture of your application performance
Atatus makes application monitoring easier with actionable insights, so you can isolate and resolve application performance issues holistically.

A comprehensive view of the behavior, performance, and health of your application and support infrastructure through high-fidelity telemetry.

Get a unified view of your application performance with one platform to fix issues faster with one connected experience.

Track your frontend performance and errors by adding just two lines of code. Get immediate insight into your users' pain points.

Extract rich resource KPIs with the least overhead on your application services, which does not impact the performance.

Make your stack trace errors readable with source maps. Un-minifying JavaScript to view the original source code. Debug minified code from production.

Filter Bots, Domains, IPs, and User Agents to gain actionable insights from the real data that matters to your business.

Integrate your Atatus issues with various project management platforms. Jira, Asana, BugHerd, GitHub, and GitLab are all supported.

Monitor your applications automatically for increased response times, API failures, and error rates. Receive notifications via Slack, Teams, Email, PagerDuty, etc.
Custom and expand your data driving without any restriction to make dive deeper into the insights that innovate you.
Frequently Asked Questions
- Improved user experiences.
- Increased developer and operational efficiency.
- Fewer incidents of poor performance.
- Time spent on innovation has increased.
- Improved application stability and availability.
- Performance issues can be resolved more quickly.
- Software releases that are both faster and of higher quality.
- Boosting conversion rates.
- Increased utilization of infrastructure.
- Increase revenue.
- Lower operational costs.
- Transaction Metrics.
- Database Monitoring.
- Network Call Performance.
- API Failures.
- Transaction Traces.
- Error Monitoring.
- Release Tracking.
- Smart Alerting.
- Runtime Metrics.
- CPU Usage.
- Memory Usage.
- Uptime.
- Average and Max Latency.
- Errors Per Minute.
- Request Per Minute (RPM).
- API Calls Per Business Transaction.
- API Retention.
- API Usage Growth.
- SDK and Version Adoption.
Application Performance Monitoring & Management
Atatus makes application monitoring easier with actionable insights, so you can isolate and resolve application performance issues holistically.