Infrastructure Monitoring
Acquire complete visibility into your infrastructure in order to diagnose and resolve performance issues that are affecting your business. Correlating application metrics, logs, and traces to troubleshoot problems faster allows you to make better business data-driven decisions.
With Atatus, You Can…

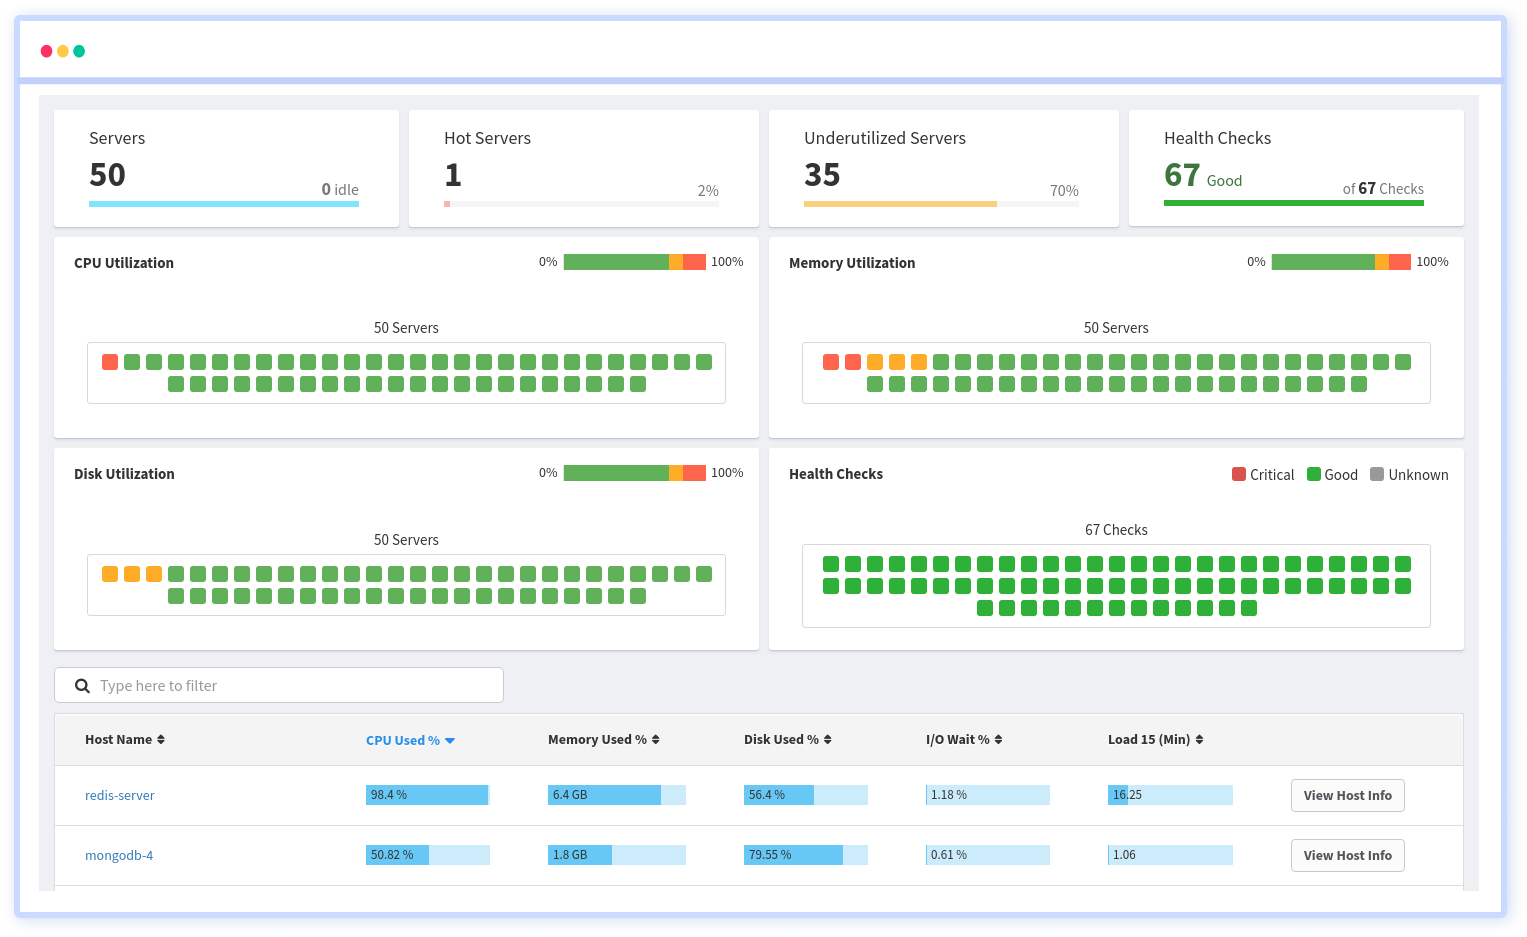
Host Monitoring
Get an enhanced overview of your servers and containers, with a summary of CPU, memory, disk, and network utilization in a single view.

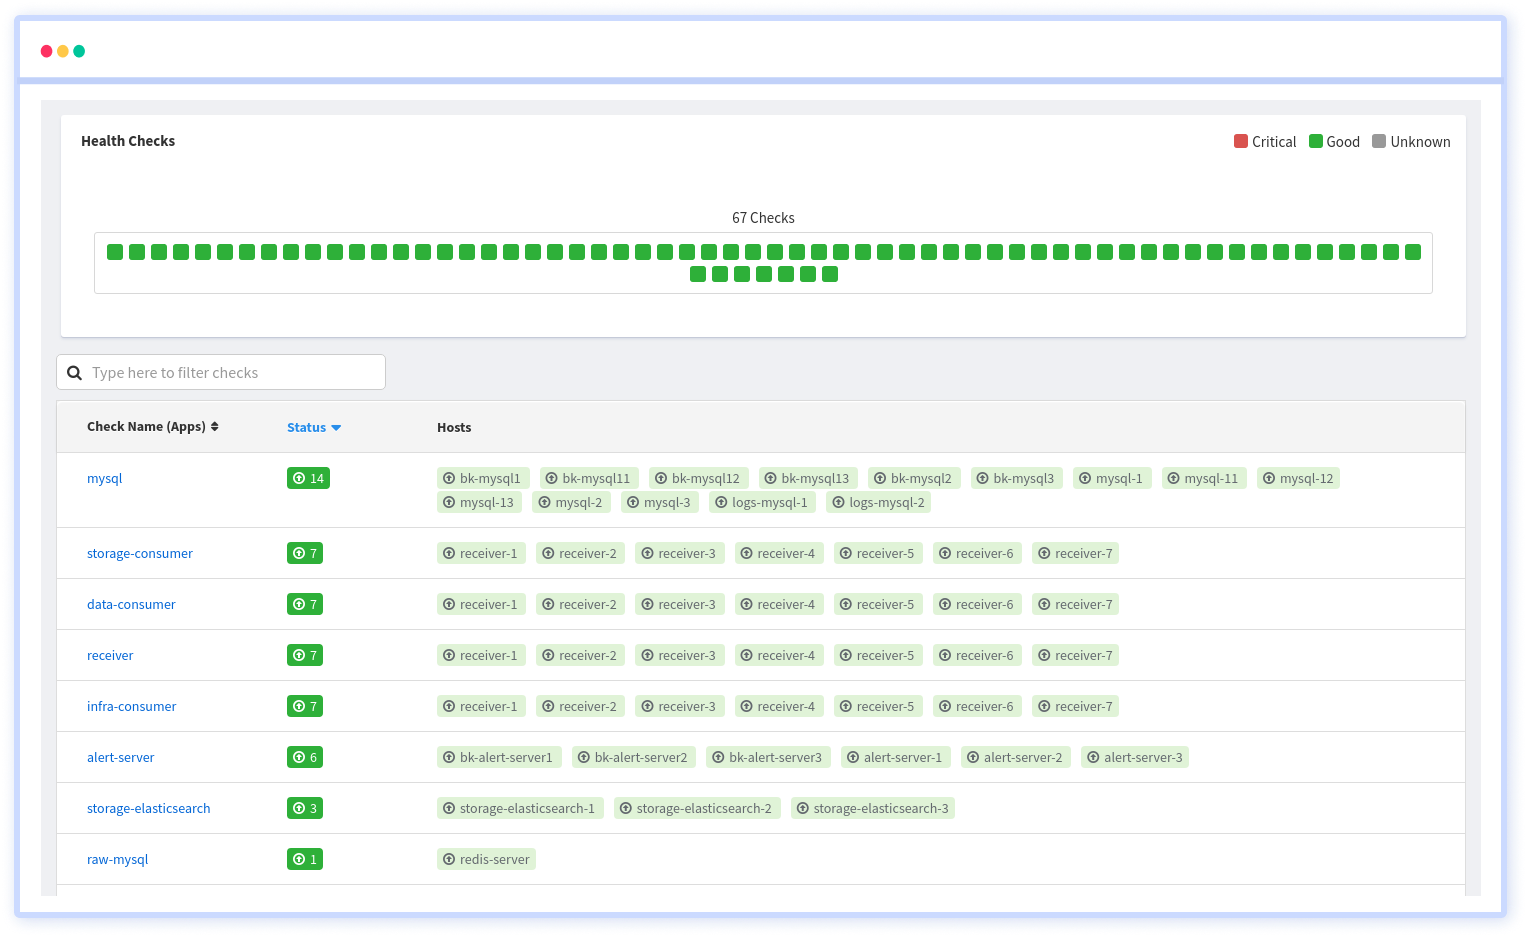
Health Checks
Set up health checks to monitor the health (uptime) of apps or services running on your servers. Get notified of any impact on the services.

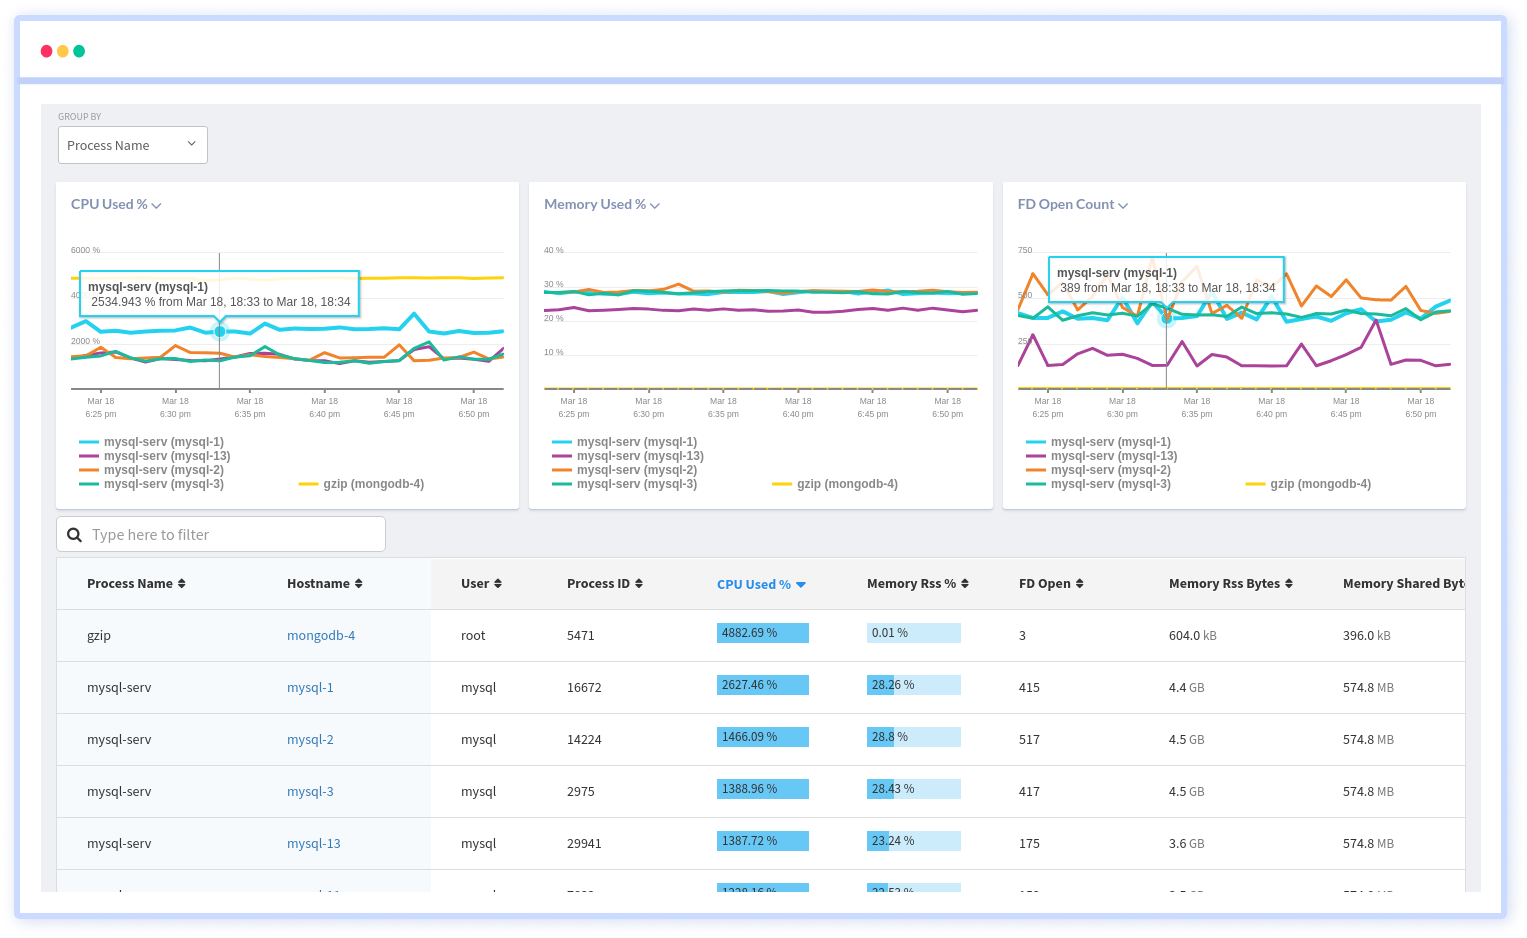
Process Monitoring
See the summary of all your resources per process, including CPU, memory, storage, and network, with detailed data for troubleshooting issues.

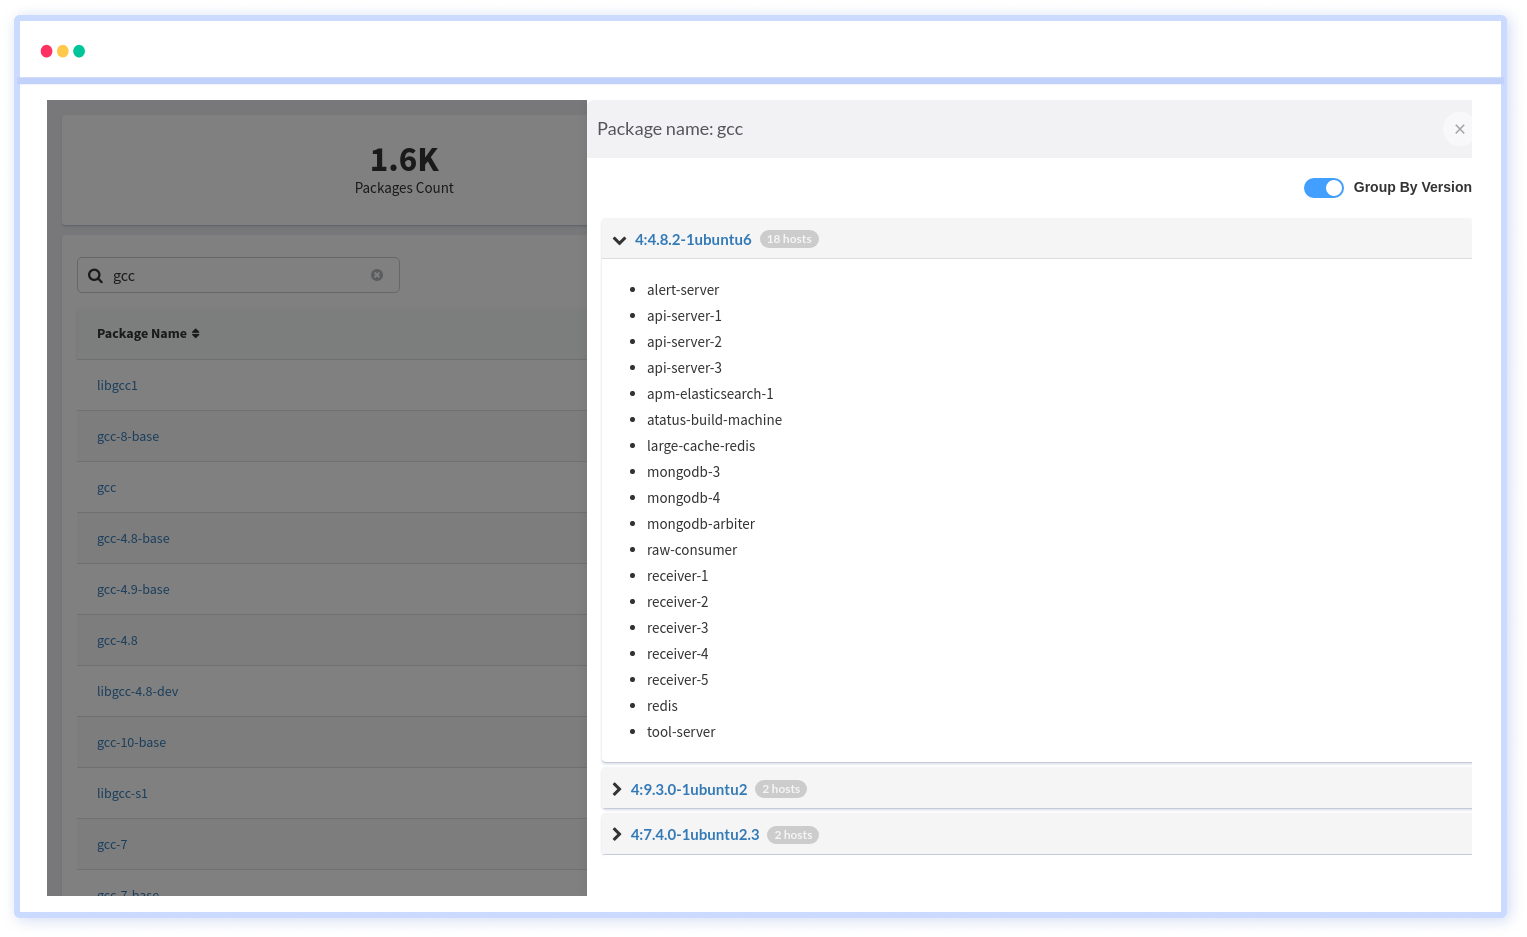
Inventory Tracking
Search, filter, and group packages and inventory data to identify security vulnerabilities, mismatches, and any user actions on your servers.

Plugins Monitoring
Keep track of all the plugins, including Redis, HAProxy, MongoDB, Nginx, etc., that you use in your application and gain key performance metrics.

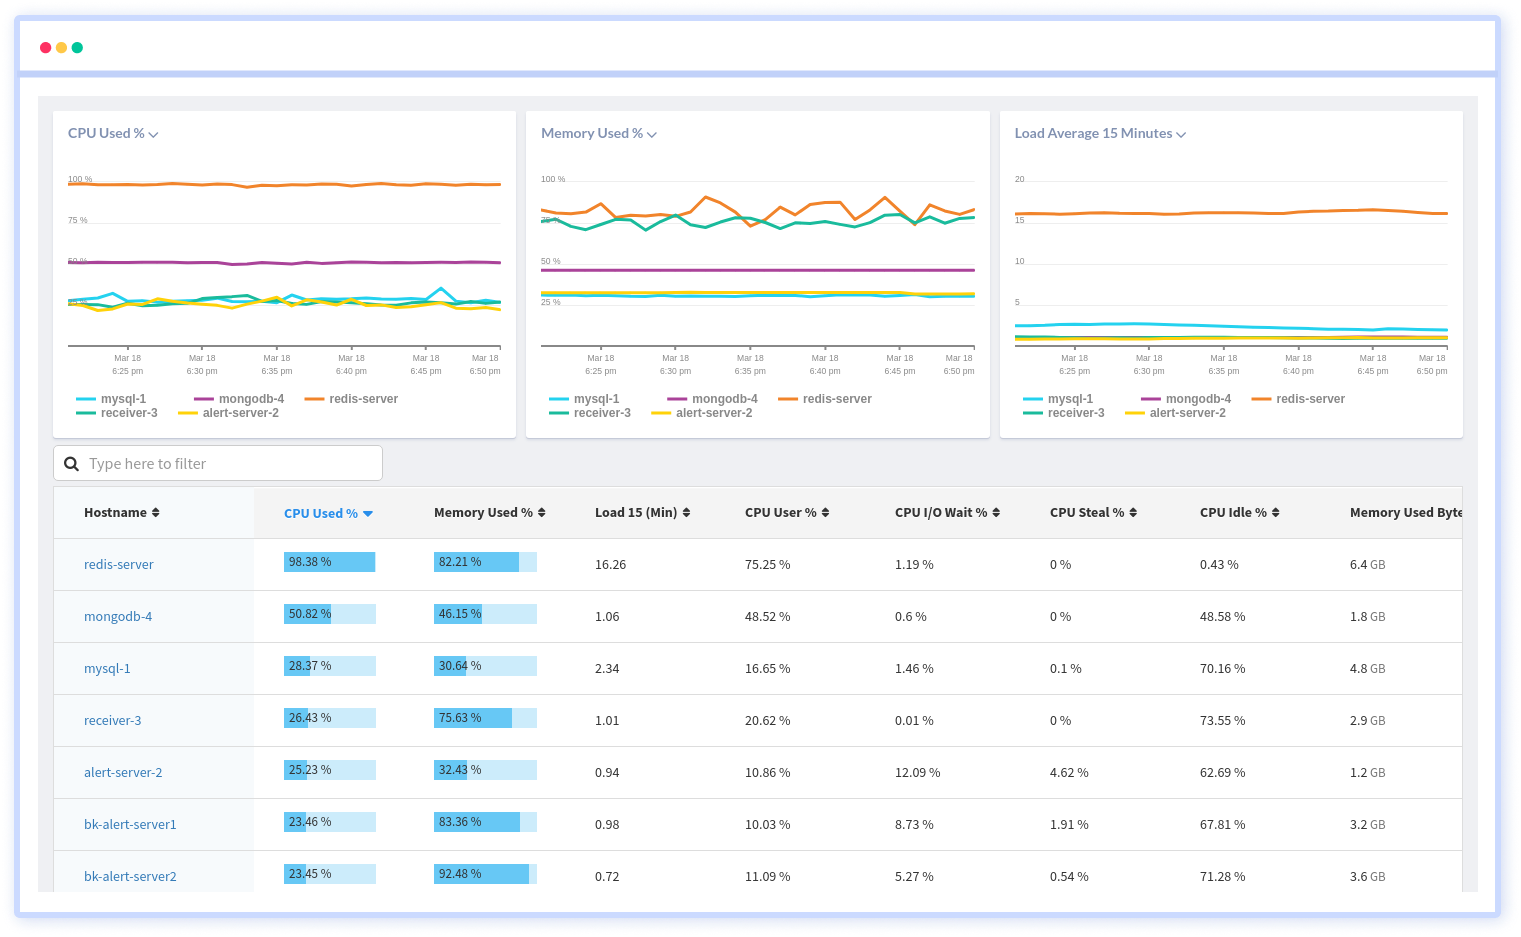
Disk, Memory and CPU Usage
Get real-time observability storage usage information at the overall disk, memory, and CPU usage levels for storage level resource performance.
Optimize your entire infrastructure in real-time
Visibility in all aspects of your infrastructure
 Keep track of the availability, performance, and resource utilization of the backend components that run in your infrastructure with infrastructure monitoring.
- Identify hosts, containers, and other backend components that failed during an incident or experienced latency, and prevent incidents from escalating into outages.
Forecast backend requirements
- Infrastructure metrics help organizations predict future resource consumption, which helps you to provide a better end-user experience.
- Get real-time information about your entire infrastructure under a single dashboard rather than manually tracking your site and updating it in spreadsheets.
Increase application stability and uptime
- Pinpoint the root cause of performance issues, and auto-correlate application performance with all supporting infrastructure tiers such as servers, virtualization, storage, network, etc.
- Enhance infrastructure operations and workflow, detect and resolve problems, and gain insight into how you are using the application.
Comprehensive alert system
- Slice and dice your infra metrics to generate fine-grained alerts or hone in on specific components of your infrastructure for investigation.
- With intelligent alerts and dynamic baseline thresholds, alert noise is reduced and bottlenecks are accurately pinpointed.
Get a complete picture of your application performance
Atatus makes application monitoring easier with actionable insights, so you can isolate and resolve application performance issues holistically.

A comprehensive view of the behavior, performance, and health of your application and support infrastructure through high-fidelity telemetry.
Get a unified view of your application performance with one platform to fix issues faster with one connected experience.

Track your frontend performance and errors by adding just two lines of code. Get immediate insight into your users' pain points.

Extract rich resource KPIs with the least overhead on your application services, which does not impact the performance.

Make your stack trace errors readable with source maps. Un-minifying JavaScript to view the original source code. Debug minified code from production.

Filter Bots, Domains, IPs, and User Agents to gain actionable insights from the real data that matters to your business.

Integrate your Atatus issues with various project management platforms. Jira, Asana, BugHerd, GitHub, and GitLab are all supported.

Monitor your applications automatically for increased response times, API failures, and error rates. Receive notifications via Slack, Teams, Email, PagerDuty, etc.

Custom and expand your data driving without any restriction to make dive deeper into the insights that innovate you.
Frequently Asked Questions
- Forecast Backend Requirements.
- Make the Most of Your Infrastructure.
- Troubleshoot Performance Issues.
- Agentless Monitoring.
- Agent Monitoring.
- Boost Reliability.
- Early Problem Detection.
- Prevent Network Outages.
- Plan an Appropriate Budget for Upgrades.
- Recognize and Respond to Security Threats.
- Increase ROI.
Optimize your entire infrastructure in real-time
Get complete visibility of your infrastructure to diagnose and resolve performance issues that impact your business.