Frontend Performance Monitoring
Achieve complete visibility into JavaScript errors and performance issues affecting your end-user experience. Fix critical issues faster with detailed data points that aid in the analysis and resolution of issues.
With Atatus, You Can…

Google's Core Web Vitals
Measure website performance and know how your web page is performing with the help of the Google core web vitals insights.

Page Monitoring
Exposing slow loading pages and elements that are actually frustrating your end users.

Single Page Application
Gain deeper visibility and actionable insights into real user interactions with single-page apps.

AJAX Monitoring
Improve the AJAX requests performance that impacts your frontend application's performance.

User journeys
Analyze your end user's web path journey all across your application to find poor experiences.
JS Error tracking
Achieve in-depth exposure to the JavaScript errors affecting your customers under a single platform.
Full stack observability for your entire application

Improvise slow loading pages
 Keep the user engaged with fast, available and functional websites that consistently offer new and enticing content by discovering potential front-end issues.
- Analyze the slow page load times and set frontend Apdex thresholds to match the responsiveness your customers expect.

Track dynamic page elements
- Perceive the load time for various resources like images, CSS, and scripts when loaded from third-party sites and CDNs, and discover how it impacts the response time of your application.
- Interactive charts with drill-down details provide insights into initial page load performance, route changes, and historical performance.

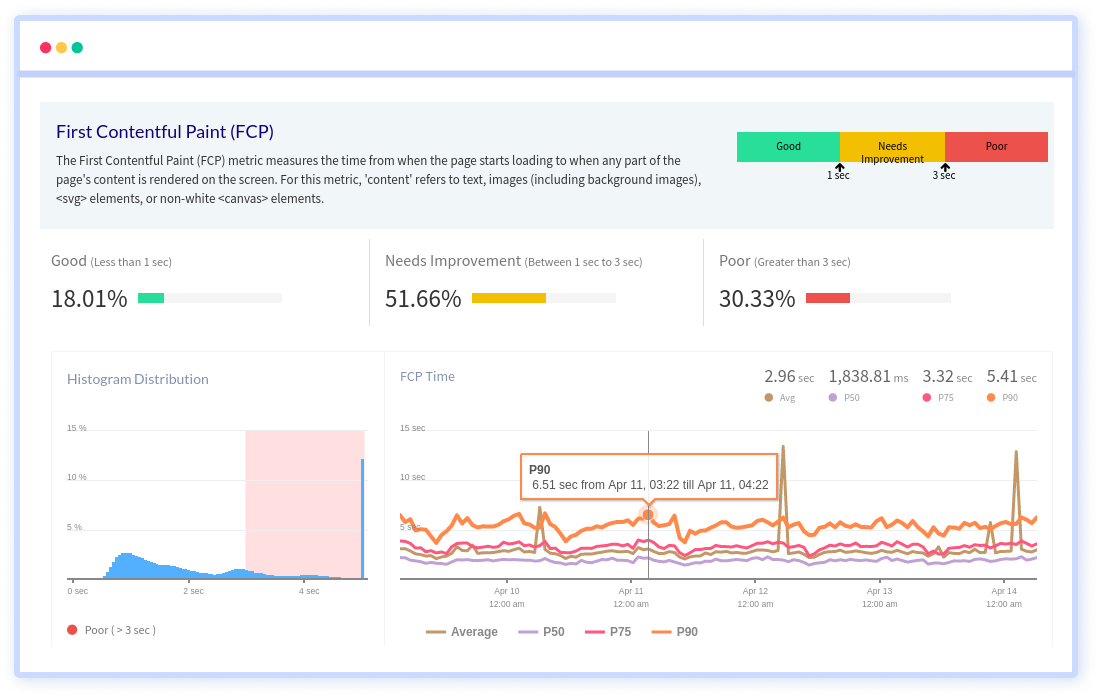
Analyze front-end performance metrics
- Keep track of bloated web pages to uncover the core critical front-end metrics that cause downtime in your web page.
- Get the performance metrics that Google utilizes to determine how users perceive your website's performance, including FCP, LCP, CLS, Input Delay and so on.

Pinpoint JavaScript errors
- Monitor frontend JavaScript exceptions and filter them by name, browser, mobile device, and other key attributes.
- Refine and compare data by time, geo-location, browser, device, and other criteria for additional control and accuracy.
Uncover performance bottlenecks in your front-end code
Atatus makes application monitoring easier with actionable insights, so you can isolate and resolve application performance issues holistically.

A comprehensive view of the behavior, performance, and health of your application and support infrastructure through high-fidelity telemetry.

Get a unified view of your application performance with one platform to fix issues faster with one connected experience.
Track your frontend performance and errors by adding just two lines of code. Get immediate insight into your users' pain points.

Extract rich resource KPIs with the least overhead on your application services, which does not impact the performance.

Make your stack trace errors readable with source maps. Un-minifying JavaScript to view the original source code. Debug minified code from production.

Filter Bots, Domains, IPs, and User Agents to gain actionable insights from the real data that matters to your business.

Integrate your Atatus issues with various project management platforms. Jira, Asana, BugHerd, GitHub, and GitLab are all supported.

Monitor your applications automatically for increased response times, API failures, and error rates. Receive notifications via Slack, Teams, Email, PagerDuty, etc.

Custom and expand your data driving without any restriction to make dive deeper into the insights that innovate you.
Frequently Asked Questions
- Framework-specific Problems
- JavaScript Errors
- Network Request Failures
- Performance Issues
- User Experience Issues
Analyze front-end performance metrics
Atatus makes application monitoring easier with actionable insights, so you can isolate and resolve application performance issues holistically.