Error Tracking
Recognize the impact on your users. Get a complete visibility into errors so you can fix errors more quickly without sacrificing user experience. View the full stack trace, telemetry, error context, mapped with your source code, and more.
With Atatus, You Can…

Transaction Metrics
Narrow down into transactions to see where your application spends the majority of its time.

Database Monitoring
Discover and resolve slow database queries in your complex architecture schema as quickly as possible.

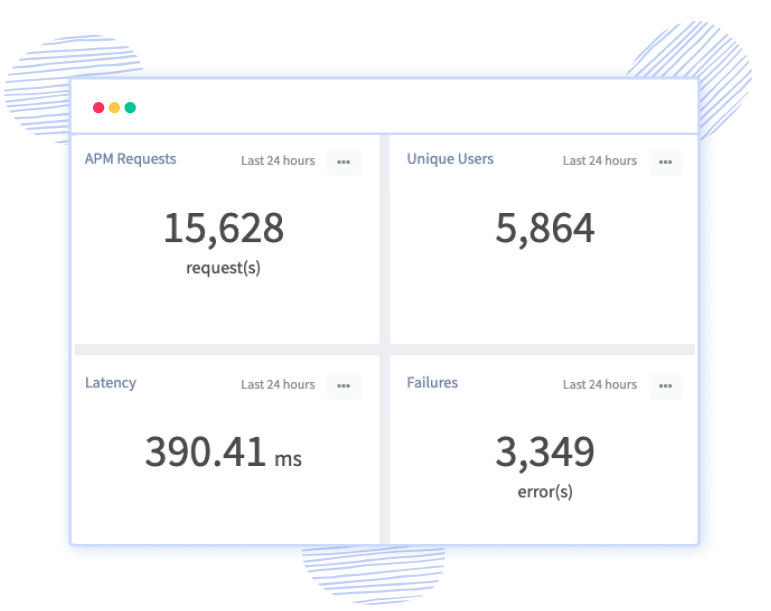
API Failures
Begin seeing hidden API failures in your application within minutes.
Error Monitoring
Reveal actionable insights quickly in order to resolve performance bottlenecks and exceptions.

Release Tracking
Track every new version releases, ship with confidence, and see how each production deployment affects your end users.

Runtime Metrics
Outlook logs, infrastructure metrics, and virtual machine metrics in relation to the original request.
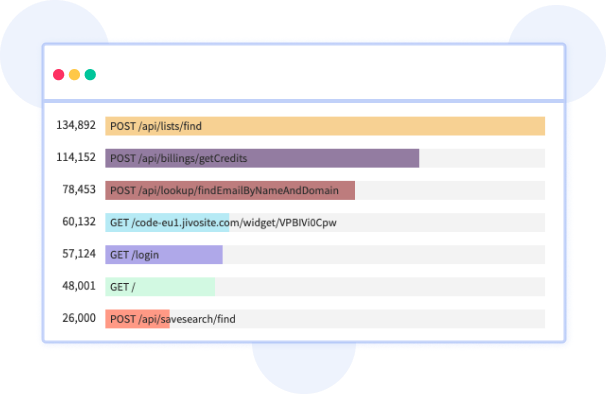
Deep API Intelligence
Complete visibility throughout your tech stack
 Capture every error that occurs in the system to provide errorless servers, full-stack, server, infra, synthetic, and logs, whereas others are designed to store error information pertaining to specific error codes selectively.
- Navigate to backend traces and logs in an instant to detect the root cause of frontend errors. Explore and rectify downtime even further.
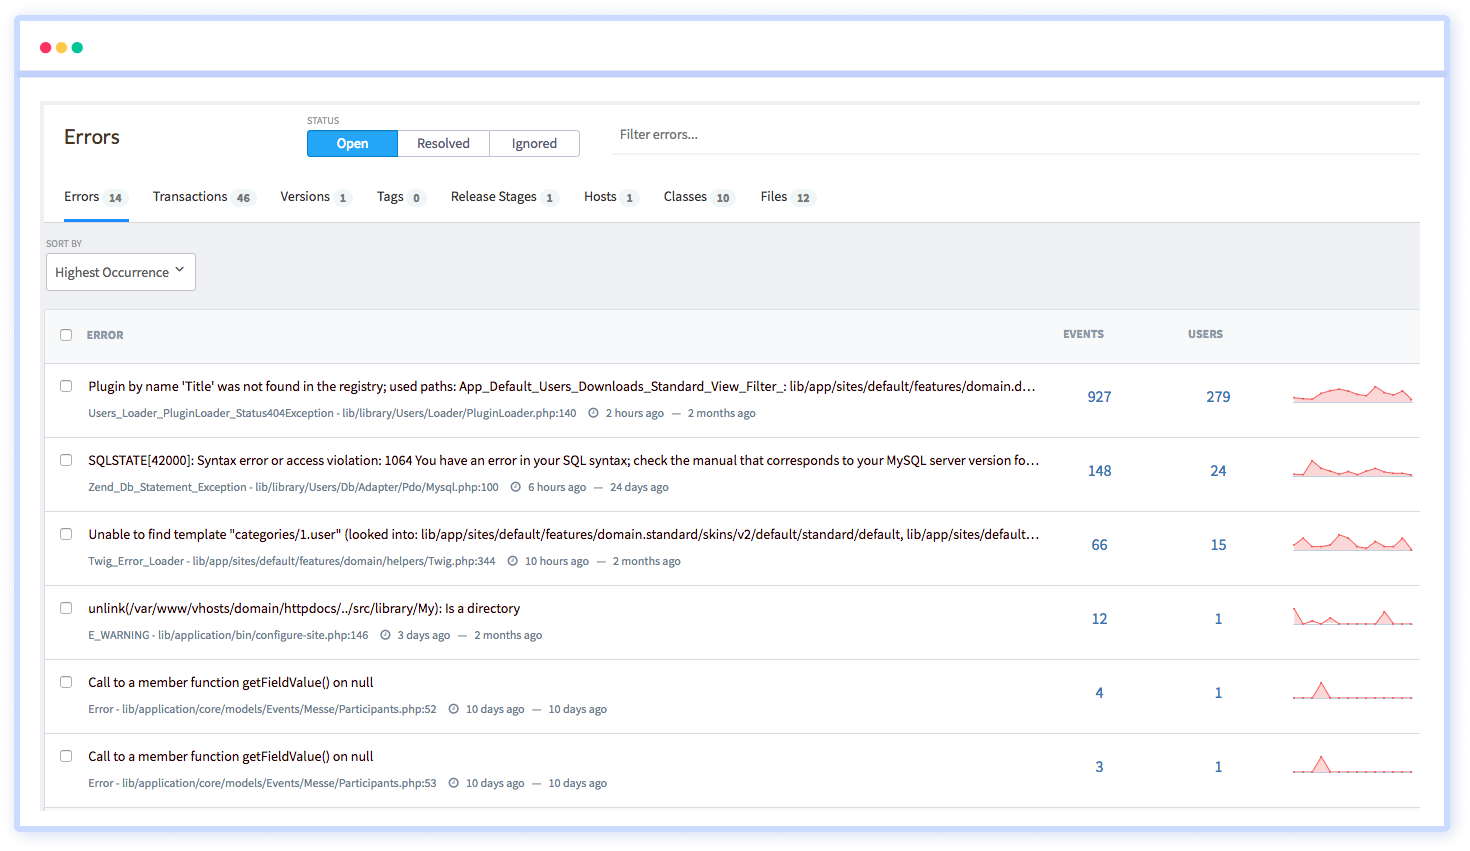
Automated encountering error logs
- Configure error logs to capture every single error which occurs in the system, whereas some are designed to store error information pertaining to specific error codes selectively.
- Dive deep into precise field values, correlate events across multiple error logs, and forecast potential future issues.
Rapidly resolve errors with code-level diagnostics
- Make data-driven decisions and manage team productivity by tracking or prioritizing with error segmentation of bugs as resolved or fixing them according.
- Debug configuration generates a slower, larger executable that empowers more interactive run-time debugging.
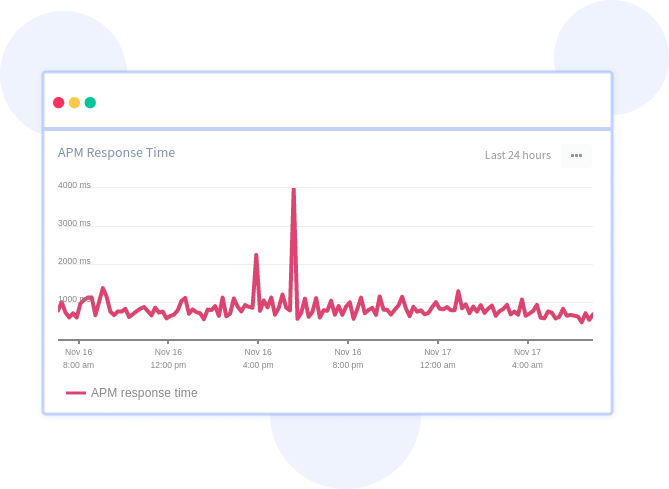
Get a complete picture of your application performance
Atatus makes application monitoring easier with actionable insights, so you can isolate and resolve application performance issues holistically.

A comprehensive view of the behavior, performance, and health of your application and support infrastructure through high-fidelity telemetry.

Get a unified view of your application performance with one platform to fix issues faster with one connected experience.

Track your frontend performance and errors by adding just two lines of code. Get immediate insight into your users' pain points.

Extract rich resource KPIs with the least overhead on your application services, which does not impact the performance.

Make your stack trace errors readable with source maps. Un-minifying JavaScript to view the original source code. Debug minified code from production.

Filter Bots, Domains, IPs, and User Agents to gain actionable insights from the real data that matters to your business.

Integrate your Atatus issues with various project management platforms. Jira, Asana, BugHerd, GitHub, and GitLab are all supported.

Monitor your applications automatically for increased response times, API failures, and error rates. Receive notifications via Slack, Teams, Email, PagerDuty, etc.

Custom and expand your data driving without any restriction to make dive deeper into the insights that innovate you.
Frequently Asked Questions
Stay on top of finding and resolving problems quickly
Spot out errors with Error Monitoring. See the full picture of any exception with in-depth diagnostics that lets you know exactly what went wrong and how to fix it.