
Log Monitoring
Log management is now available as a fully managed cloud service. Easy setup, no upkeep, and any scale mean you can concentrate on your business rather than on data pipeline maintenance.
Monitor log events in real time
Streamline log data
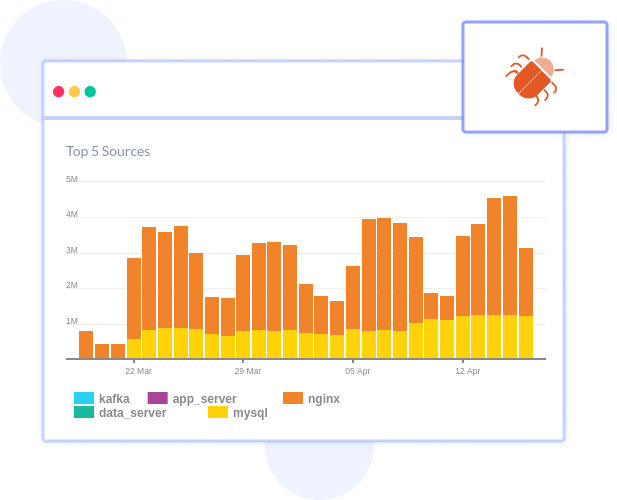
 By bringing all the log events and data into one place, you can explore log data and issues easily.
- This can help you make better decisions about your business.
- Using structured log data makes it easier to search, index, and store. Log monitoring provides a complete view of exactly what happened in your application.
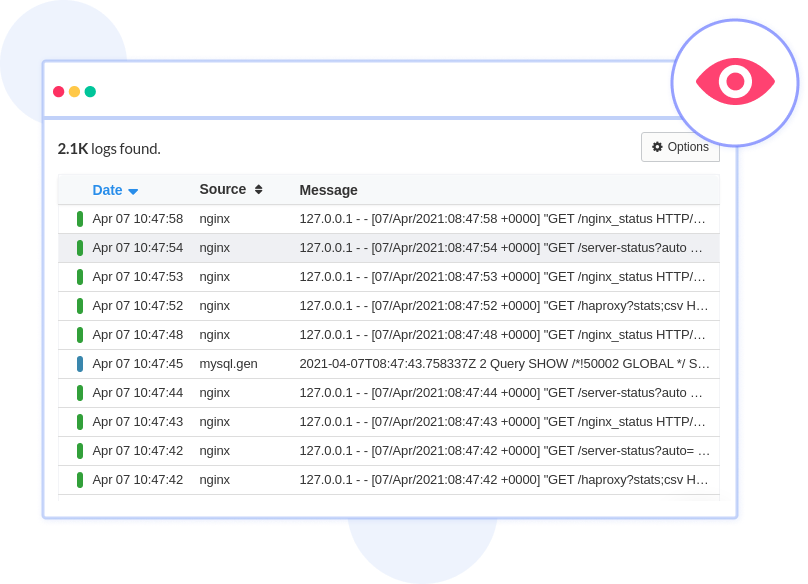
Log searching and filtering
- Refine your logs with the help of intuitive and out-of-the-box filtering, with which you can find the log entries of your interest and save time.
- Get search responses within a second and respond to the incidents faster to discover the issues before they impact your end-users.
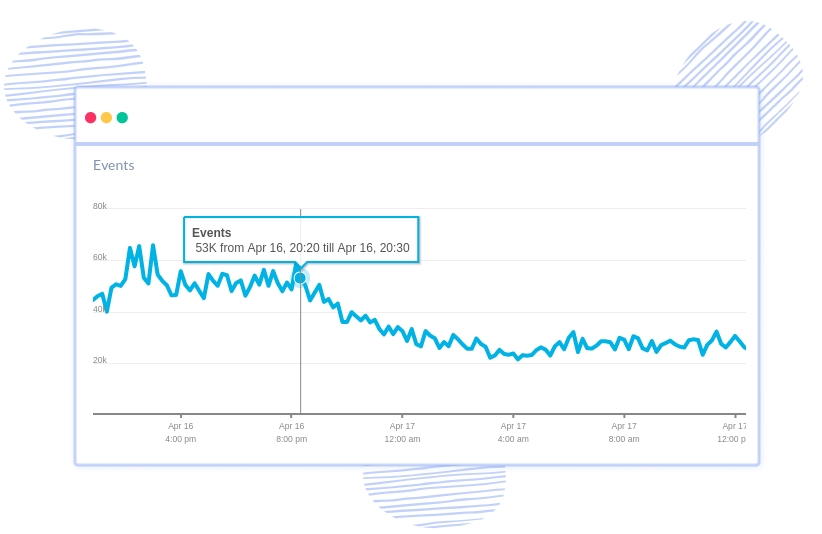
Live Tail
- Use live tail to view data from numerous sources in real-time. Analyze and aggregate log events seamlessly across apps, devices, and systems.
- Reduce configuration time and spend more time on insight with full support for hundreds of millions of log sources.
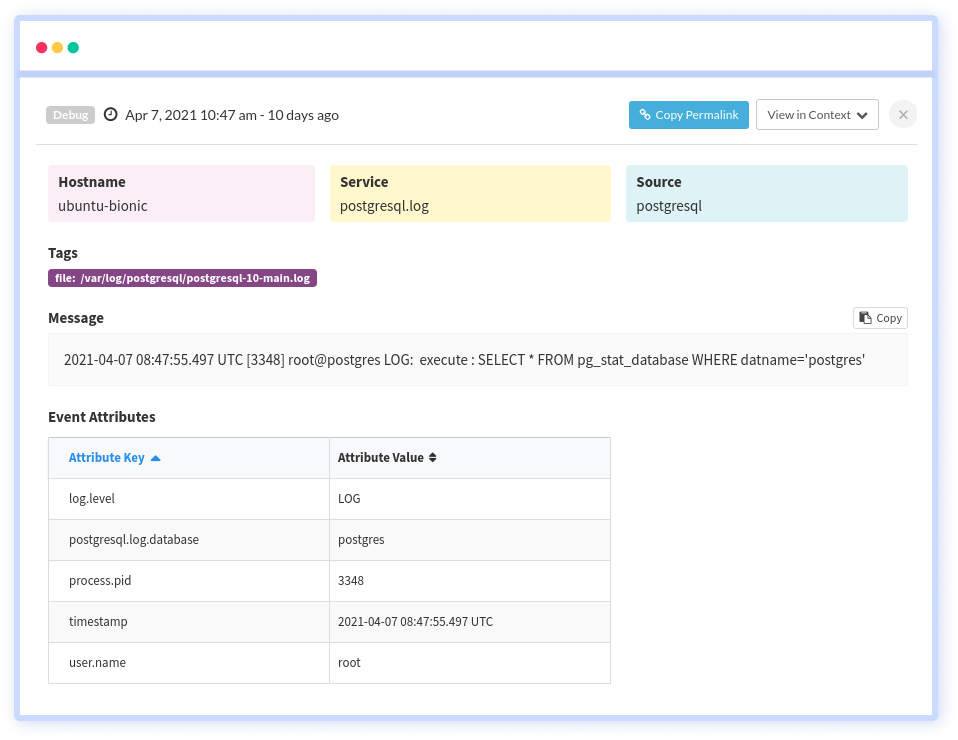
Log retention and recovery
- Our automated solution archives logs into your desired external storage, like Amazon S3, along with metadata in a pre-described JSON format.
- It can be imported back to be analyzed again.
- A good backup and recovery plan can minimize data loss and downtime of your application and helps you deliver a delightful end-user experience.
Get a complete picture of your application performance
Atatus makes application monitoring easier with actionable insights, so you can isolate and resolve application performance issues holistically.

A comprehensive view of the behavior, performance, and health of your application and support infrastructure through high-fidelity telemetry.

Get a unified view of your application performance with one platform to fix issues faster with one connected experience.

Track your frontend performance and errors by adding just two lines of code. Get immediate insight into your users' pain points.

Extract rich resource KPIs with the least overhead on your application services, which does not impact the performance.

Make your stack trace errors readable with source maps. Un-minifying JavaScript to view the original source code. Debug minified code from production.

Filter Bots, Domains, IPs, and User Agents to gain actionable insights from the real data that matters to your business.

Integrate your Atatus issues with various project management platforms. Jira, Asana, BugHerd, GitHub, and GitLab are all supported.

Monitor your applications automatically for increased response times, API failures, and error rates. Receive notifications via Slack, Teams, Email, PagerDuty, etc.

Custom and expand your data driving without any restriction to make dive deeper into the insights that innovate you.
Frequently Asked Questions
- Event Logs.
- Server Logs.
- System Logs.
- Authorization and Access Logs.
- Change Logs.
- Availability Logs.
- Resource Logs.
- Threat Logs.
Investigate log analytics with Atatus Logs Monitoring Tools
Log management delivered as a fully managed cloud service. Minimal set up, no maintenance, any scale. so you can focus on your business rather than maintaining data pipelines.