Real User Monitoring
Atatus reveals failures and bottlenecks in web applications before customers notice them. Capture every aspect of the user experience, from initial HTTP request to elements loading in user's browser.
With Atatus, You Can…

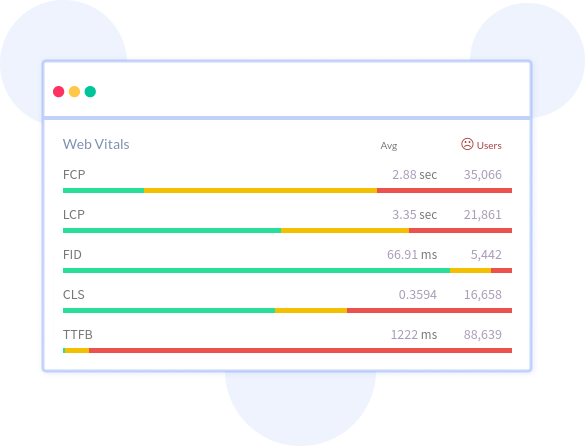
Google's Core Web Vitals
Measure front-end code and web page performance with Google core web vitals insights.

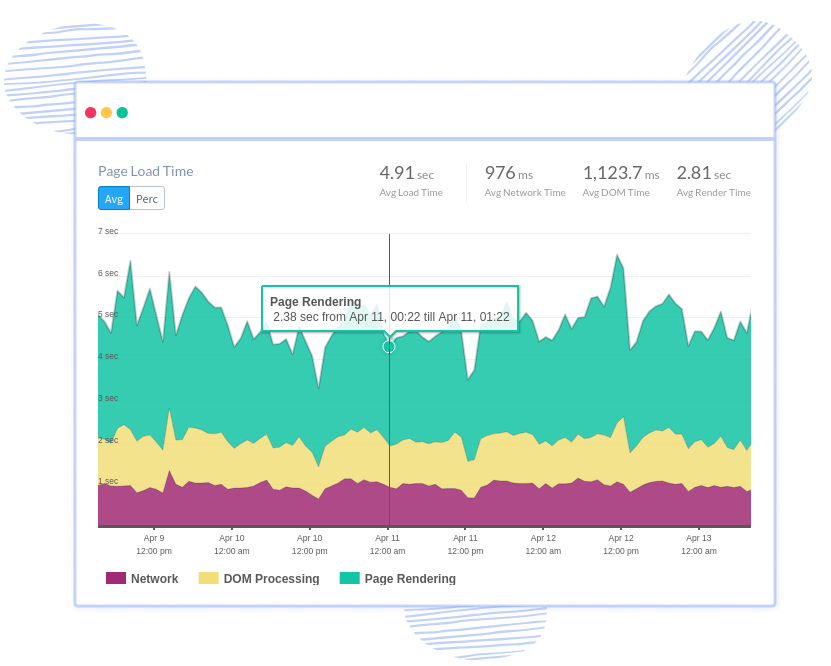
Page Monitoring
Get slow loading pages and elements exposed that are actually frustrating your end users.

Single Page Application
Gain deeper visibility and actionable insights into real user interactions with single-page apps.

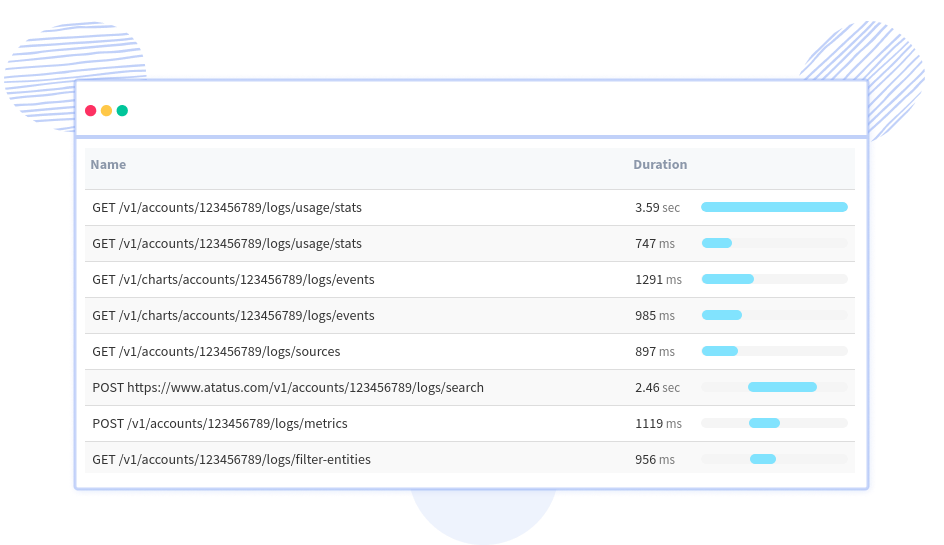
AJAX Monitoring
Improve the AJAX requests performance that impacts your frontend application’s performance.

User Journeys
Analyze your end user’s web path journey all across your application to find poor performance.
Error Tracking
Trace out the javascript errors of your application for smooth frontend experience.
Understand what is interrupting an error-free experience
Unified intuitive insights on real user
 Gain comprehensive insights into your applications' user experiences and the fine-grained performance issues.
- Proactively detect issues in your API endpoints and critical journeys that affect actual users anywhere in your application.
Comprehend your front-end performance issues
- Start tracking and measuring the end-user experience in your application.
- Investigate issues, and transform from RUM data to receive traces and logs for complete context.
- Monitor combined full-stack in a single platform for frontend and backend development.
Unique qualities tailored to your use case
- Understand user behavior and application performance using the metrics in your global context.
- Determine if an error spike is related to a particular version of your code, grouped by this value.
- Filter RUM data by any other attribute within your global context.
Get a complete picture of your application performance
Atatus makes application monitoring easier with actionable insights, so you can isolate and resolve application performance issues holistically.

Comprehensive view of the behavior, performance, and health of your application and support infrastructure through high-fidelity telemetry.

Get a unified view of your full-stack application performance to fix issues faster with one connected experience.
Track your frontend performance and errors by adding just two lines of code. Get immediate insight into your users' pain points.

Extract rich resource KPIs with the least overhead on your application services, which does not impact the performance.

Make your stack trace errors readable with source maps. Un-minify JavaScript to view the original source code.

Filter Bots, Domains, IPs, and User Agents to gain actionable insights from the real data that matters to your business.

Integrate your Atatus issues with various project management platforms like Jira, Asana, BugHerd, GitHub, and GitLab.

Receive notifications via Slack, Teams, Email, PagerDuty, etc. Monitor your applications automatically.

Custom and expand your data driving without any restriction to make dive deeper into the insights that innovate you.
Frequently Asked Questions
APM traces user transactions that cover the end to end web application and tracks potential bottlenecks and factors that contribute to issues.
Synthetic monitoring is exceptional. It provides a foundation for how your website performs in a restricted environment.
2. Issues will be prioritized if they are easily identified. More efficiently
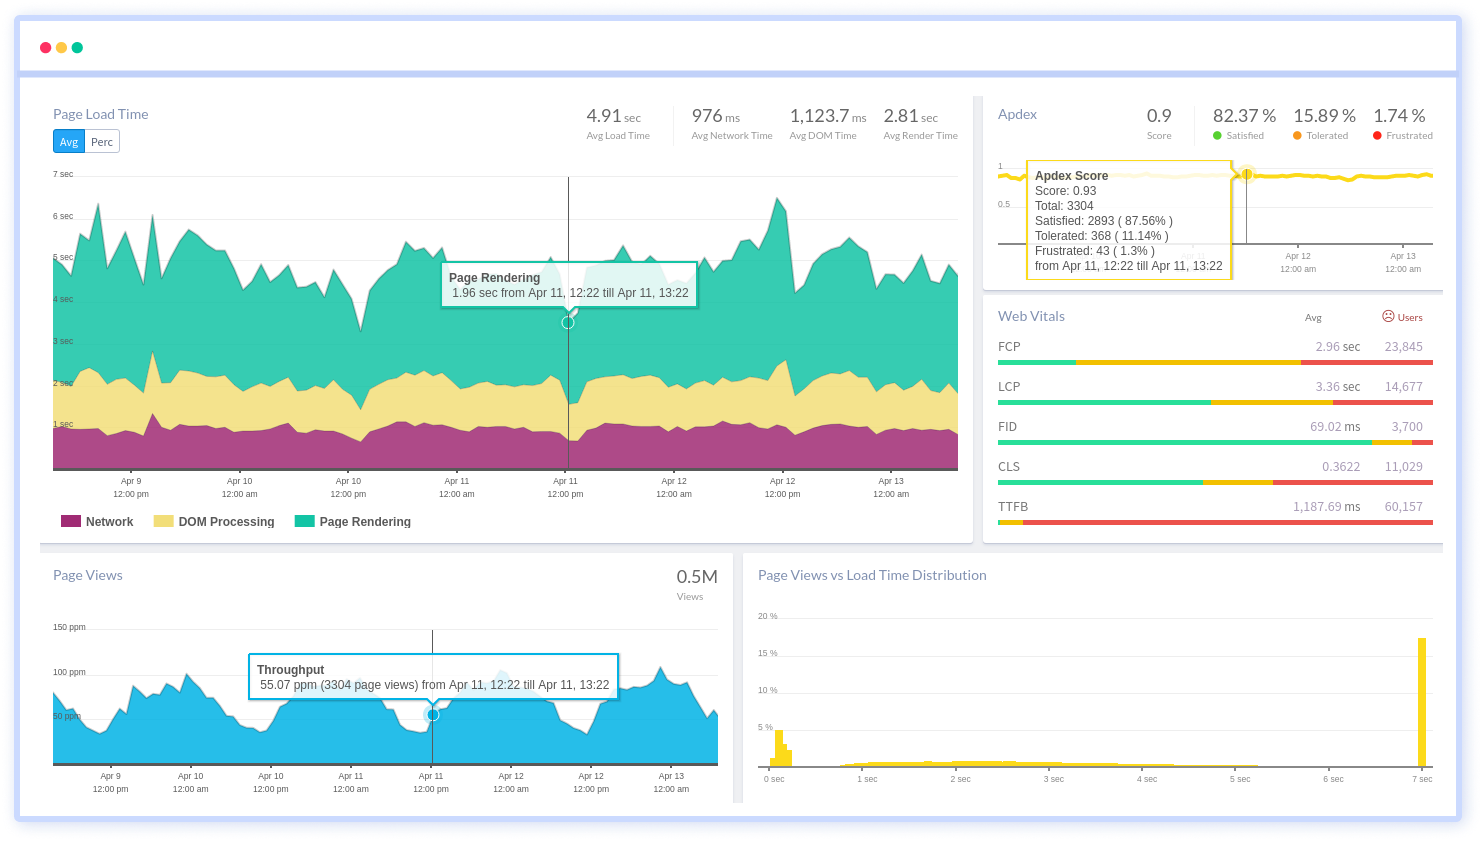
3. Identify Network and Page-level Problems
4. Measure user satisfaction using apdex score
5. Get user-centric metrics
6. Gain performance trends across geographical locations
Monitor web performance with Real User Monitoring
Our solution provides a scalable, end user experience monitoring solution that helps you gain visibility on poor performing parts of your website that are impacting your end users.