Synthetic Monitoring
Replicate user interaction to test the accessibility of your website or application with Synthetic(Uptime) Monitoring. Assess the speed and capabilities of your application, and receive accurate and actionable insights in an easy-to-use dashboard.
With Atatus, You Can…

Ping Monitoring
Boost full-stack visibility into the performance of your network devices by continuously pinging the network hosts to diagnose outages.

SSL Monitoring
We provide SSL monitoring to keep track of the expiration date of your SSL certificate so that you don't lose it.

Website Monitoring
Track and measure your website's connection speed and browser load times to ensure its availability.

DNS Monitoring
Eliminate malicious attacks on your domains and servers by verifying the DNS records on a regular basis for any unexpected changes or local outages.

MicroServices Monitoring
At the specified frequency, check the reliability of any specific ports such as HTTP, SSL, TCP, and ICMP from various locations.

Keyword Monitoring
Using our Keyword Checker, ensure that you have sent the correct texts in your request and response headers (HTML or JSON).
Receive comprehensive insight of the performance of your application
Test your app from an end-user perspective
 Measure the true end-user experience of your website or applications by monitoring all the dynamic components at the real-time browser level.
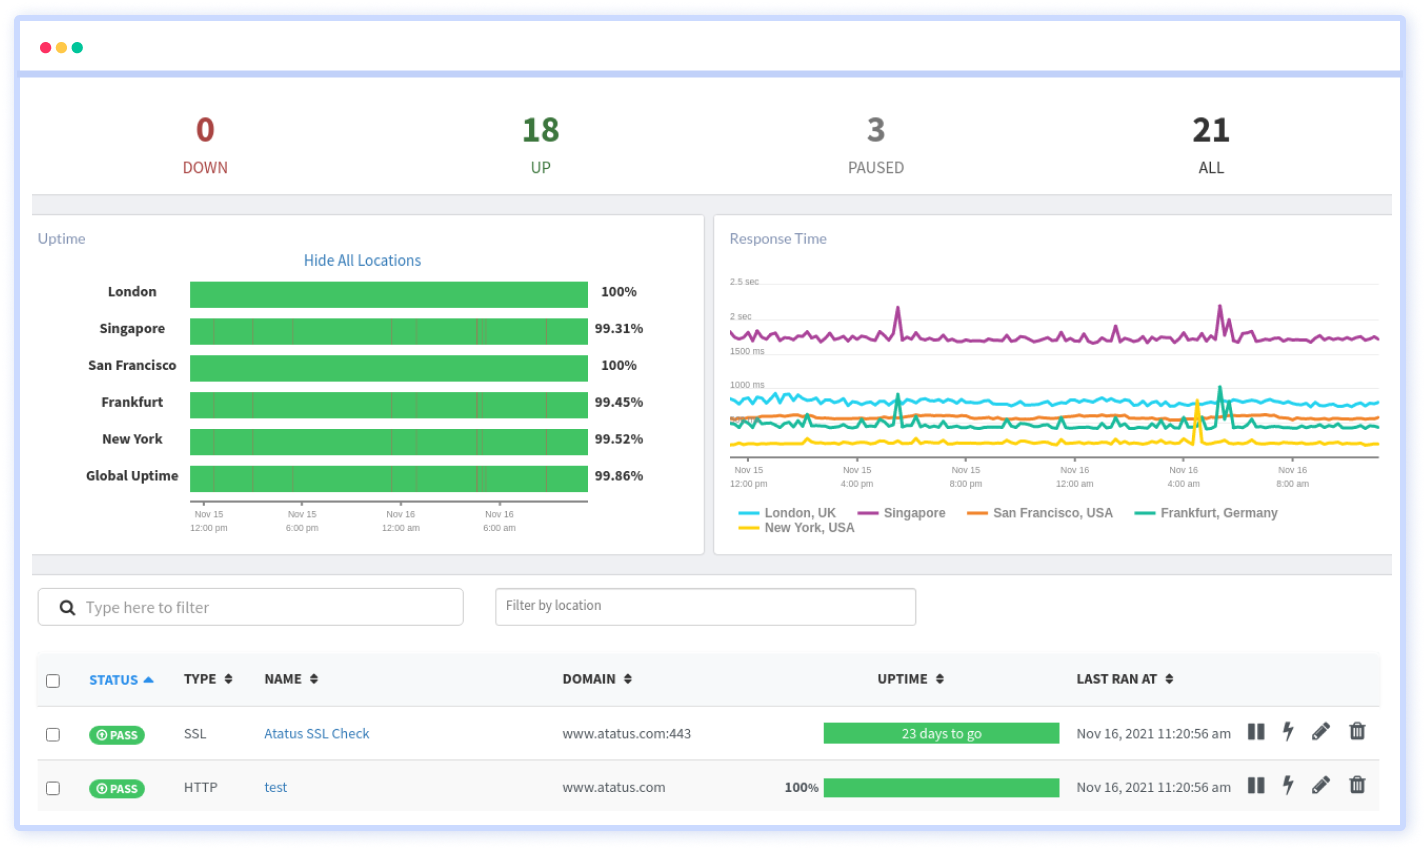
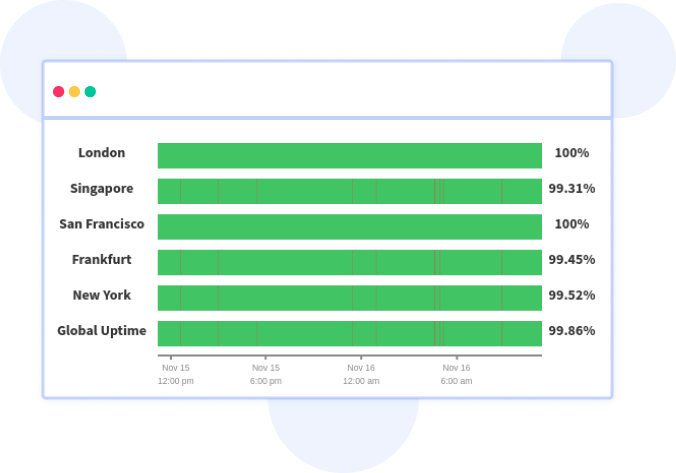
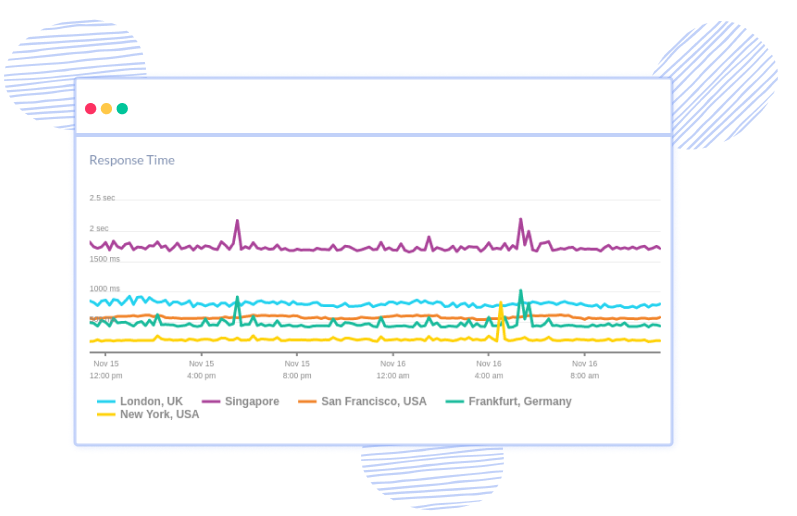
- We run the monitors from different geographical locations, using different browsers on actual devices and internet service providers.
- With realistic monitoring, you can gain insight into global uptime, response time by location, test status, and duration.
Increase resiliency
- Simulate traffic to an area where your app or website doesn't have real user traffic where user yet to ensure performance and availability.
- You can also check the performance of your applications from the desired location for any performance issues before your end users encounter them.
Benchmark your website
- The APIs in your applications can be monitored with synthetic monitoring at any time, and at any location you choose.
- Also, you can use this monitoring data over time to measure the performance of your application, identify opportunities for improvement, and develop strategies to improve performance.
- Synthetic monitoring can also be used to benchmark your application's performance and availability compared to your previous performance.
Enhanced synthetic tests and reports
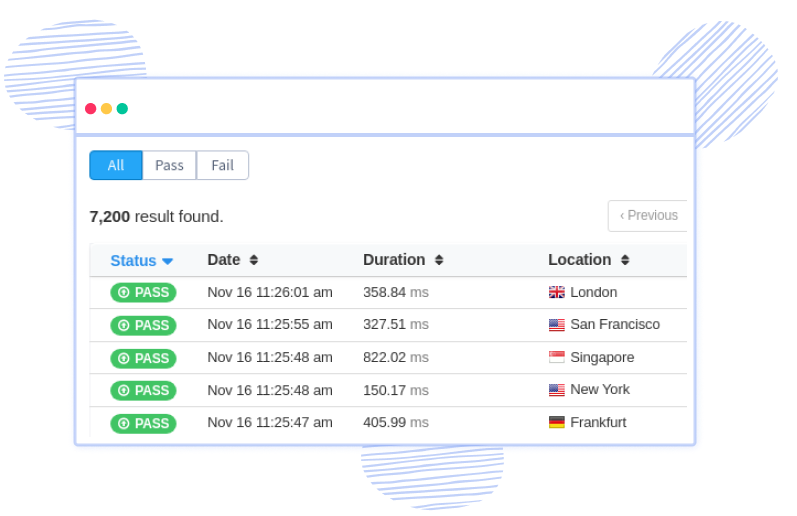
- Synthetic monitoring aggregates each test result into metrics, which allows you to identify patterns in poor performance and find solutions.
- You can also view each monitor result stored with synthetic monitoring to see exactly where problems occurred.
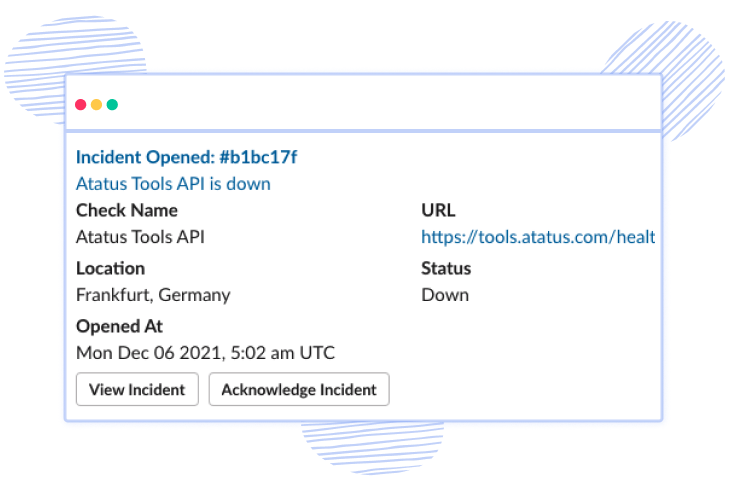
- Whenever there is an issue with your website or API endpoint, you receive an alert. For a closer look at your monitor results, you can filter and sort them.
Get a complete picture of your application performance
Atatus makes application monitoring easier with actionable insights, so you can isolate and resolve application performance issues holistically.

A comprehensive view of the behavior, performance, and health of your application and support infrastructure through high-fidelity telemetry.

Get a unified view of your application performance with one platform to fix issues faster with one connected experience.

Track your frontend performance and errors by adding just two lines of code. Get immediate insight into your users' pain points.

Extract rich resource KPIs with the least overhead on your application services, which does not impact the performance.

Make your stack trace errors readable with source maps. Un-minifying JavaScript to view the original source code. Debug minified code from production.

Filter Bots, Domains, IPs, and User Agents to gain actionable insights from the real data that matters to your business.

Integrate your Atatus issues with various project management platforms. Jira, Asana, BugHerd, GitHub, and GitLab are all supported.

Monitor your applications automatically for increased response times, API failures, and error rates. Receive notifications via Slack, Teams, Email, PagerDuty, etc.

Custom and expand your data driving without any restriction to make dive deeper into the insights that innovate you.
Frequently Asked Questions
- Resolve Performance Issues Before They Affect Your Users.
- Benchmark Your Website.
- Test Your Ability to Scale.
- Test Out New Features of Products.
- Track Important Business Processes and Third-Party APIs.
- Ensure SLA Compliance.
- Reduce MTTR.
- Uptime Monitoring.
- Web Performance Monitoring.
- API Monitoring.
- Synthetic Transaction Monitoring.
- Browser Monitoring.
- HTTP Monitoring.
- Create and Name the check.
- Define Steps.
- Select Location.
- Set a frequency for testing.
- Defining alert conditions.
- Notify your team.
Real User Monitoring (RUM), on the other hand, is a passive type of monitoring that observes rather than simulates interactions between the website and real users. A small piece of JavaScript code embedded in the website will record every transaction and contact between the end user and the server.
Monitor your website 24x7 using Synthetic Monitoring
Check the slowness, functionality of your application and get accurate and actionable insights in an intuitive dashboard.